Past CNS Talks
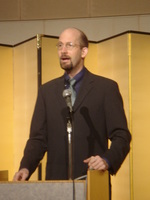
Abstract: It is no secret that the world is drowning in data. Technologies for collecting and storing data have resulted in a data glut that has given rise to the rather general, catch-all topic of "Big Data".
In many circles, Big Data has taken on a very specific meaning of searching through large amounts of end-user data for a web site, to project their behavior and tune the site to some optimal performance. In this sense, Big Data is roughly the same as SEO. It is natural that this sort of application of big data would come first; the data is collected by and belongs to a single organization, and the value from correct analysis of that data goes back to that same organization.
In this talk, I want to introduce a trend in Big Data that has much more potential for having a lasting impact on the world. It is something that I call /Industrial Big Data/. Like Big Data within an enterprise, Industrial Big Data involves large amounts of interconnected data, over which we wish to perform a wide variety of complex queries. But in addition to these features of Big Data, Industrial Big Data involves data from multiple sources, with multiple ownership, where the benefits of successful analysis apply not only to a single enterprise, but to whole industries.
Industrial Big Data goes beyond the technological considerations of the size and complexity of the data, to include business motivations for sharing data, data provenance and data governance. Several industries (including Pharmaceuticals, Oil and Gas, and Finance) are facing Industrial Big Data challenges today. Because of the differences in business dynamics between these industries, the particulars of their Big Data challenges differ, as do the approaches they are taking to address these challenges.
For all of these industries, the stakes are high. In this talk, I will evaluate how well these approaches are working, and examine the dire consequences these industries may face if they fail.
Bio: Dean Allemang has been working in Semantic Web since before it had that name, first as a researcher in Knowledge Representation, and then as a solutions engineer working on semantic applications before the advent of RDF. Since the adoption of the Semantic Web standards, he turned his experience into a Semantic Web training course, with over 1000 graduates to date. Co-author of Semantic Web for the Working Ontologist, he has delivered keynote addresses at many conferences and meetings, including Semantic Technology and Business, RuleML, OWLED and DAMA day. He now leads Working Ontologist LLC, a company devoted to making the best Semantic Web engineers available for challenging data management projects.
| 6:00 PM | Woodburn Hall 200 (Hosted by Cassidy Sugimoto)

Data Cartography: using maps to navigate knowledge networks of the 21st century
Jevin D. West
Abstract: The digital age forever changed scholarly communication. Millions of articles are instantly available any time, anywhere — a breakthrough in document delivery. We now await comparable breakthroughs in document discovery. Can machine discoverability keep pace with the ever increasing growth and complexity of information? I am optimistic it can. The most beautiful and salient feature of the world's corpora are the trails left behind from one generation of scholars to the next. This vast network — the millions of documents (nodes) and hundreds of millions of citations (links) connecting these documents — provides the perfect substrate for navigation. In this presentation, I will talk about new approaches for mapping these large networks and how these maps can facilitate scholarly navigation.
Bio: Jevin is an Assistant Professor in the iSchool at the University of Washington. He builds models, algorithms and interactive visualizations for improving scholarly communication and for understanding the flow of information in large knowledge networks. Jevin co-founded Eigenfactor.org — a free website and research platform that librarians, administrators, publishers and researchers use to map science and identify influential journals, papers and scholars. The metrics have become an industry standard, and his research has been featured in The Chronicle of Higher Education, Nature and Science. Some of his most recent research involves recommendation, auto-classification, and scholarly metrics.
| 4:00 PM | Woodburn Hall 200
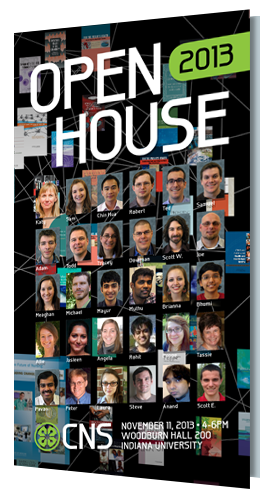
Abstract: Each year, we invite our friends, colleagues and invited to join us for two hours of enlightening talks, hands-on demos, snacks and drinks! We work hard to make our Open House a fun and educational soirée. Guests are free to roam about, explore our visualizations, enjoy snacks and drinks, and of course ask questions!

Abstract: This hands-on session introduces the concept of network communities and explore several tools to detect communities. We will discuss how community analysis can be applied and the characteristics of various methods. We will play with multiple tools, both command-line tools and GUI tools to identify communities.
Bio: Dr. Yong-Yeol Ahn is an assistant professor at Indiana University School of Informatics and Computing and a co-founder of Janys Analytics. He earned his Ph.D. from Physics Department at KAIST in early 2008 and was a postdoctoral researcher at the Center for Complex Network Research at Northeastern University and a visiting researcher at the Center for Cancer Systems Biology at Dana-Farber Cancer Institute from 2008 till 2011. He is interested in the structure and dynamics of complex systems, such as society and living organisms.
| 6:00 PM | Woodburn Hall 200

Reading the tea leaves of patent activity to discern innovation gaps and bounties
Mike Pellegrino
Abstract: The hysteria surrounding the competition between Apple and Samsung and their respective patent warring in the media has been remarkable. What is less remarkable about the hysteria is the depth of the analysis associated with the facts surrounding the relative positions of each company in the war. To quote Sun Tzu, “All warfare is based on deception.” The same holds true in many instances of the protracted litigation between Apple and Samsung. A variety of published articles paints Apple’s patent portfolio in a very strong position. For example, IEEE Spectrum ran an article in 2011 claiming that Apple had the most powerful patent portfolio in consumer electronics. While such a claim is rather broad and encompassing of an industry that comprises a variety of products beyond cellular telephones and portable electronic devices, is there truth to what IEEE published or are the claims unsubstantiated rhetoric? Granted, Apple generates remarkable revenues and profits with its market offerings. However, does this strength relate to Apple’s core patent portfolio or from other IP types, such as its trademark or copyright portfolios. This presentation walks the observer through the claims of Apple’s patent portfolio power through several tests, especially in the context of the ongoing litigation with Samsung. The observer is left to evaluate whether the empirically observed macro patent-related actions of Apple and Samsung differ from what publishes in the media and in the voluminous filings regarding the Apple and Samsung litigation.
Bio: Mike Pellegrino is the Founder and President of Pellegrino & Associates, LLC. As a leading expert in the embedded software and intellectual property valuation industry, he focuses on providing credible and equitable valuations for investment and tax reporting purposes. With his cutting-edge approach, he challenges old practices and develops new, applicable methods to aid IP valuation. His approach helps valuation analysts assess risk and quantify discount rates, select proper valuation methods, and perform necessary due diligence. Mike has testified in court proceedings regarding IP and software valuation cases and has been applauded for his efforts. One North Carolina court stated that his work is “clearly in the mainstream of IP valuation methodologies.”
Mike continues to educate the industry with articles based on technology and IP valuation methods found in the likes of IAM Magazine, Valuation Strategies, The Journal of Taxation, CFO Magazine, Business Valuation Resources, Entrepreneur.com, MSNBC.com, etc. He is the author of the first and second editions of the book titled BVR’s Guide to Intellectual Property Valuation, a handy guide containing real-world case studies and explanations for drawing credible and defensible IP value conclusions. Mike also frequently speaks at various forums around the globe regarding valuation, intellectual property, and embedded software topics. In addition, he has developed a state-of-the-art decision tool engine to help clients evaluate technological innovations based on their market viability.
A strong advocate on the importance of valuations and tax matters, Mike became an instrumental player in changing Indiana law regarding the valuation of embedded application software for personal property tax reporting purposes and the taxation of patent-derived income. He authored the administrative rules that Indiana’s Department of Local Government and Finance now uses to administer the evaluation of software appraisals for property tax matters.
Mike holds a Bachelor’s degree in computer science and a Master’s degree in business administration. He also attended accounting classes and fulfilled requirements in the leadership development program at the Center for Creative Leadership. He has completed both the 15-hour and 7-hour update USPAP training programs, is current with all USPAP training, and has passed all required USPAP exams.
| 6:00 PM | Woodburn Hall 200

Visual Analytics: The Right Solution for Big Data and Global Challenges
Dr. David S. Ebert
Abstract: The availability of tremendous volumes and types of data offers a grand opportunity to impact policy, decision making and action from the local to the global scale. However, it also presents a grand challenge: How to turn the deluge of data into relevant, actionable information. In this talk, I'll describe our work in visual analytics to solve this challenge and create effective and efficient decision making environments. I'll also describe visual analytics uses for risk-based decision making, resource allocation, resiliency, public health, infrastructure, and security and safety, as example areas where our Center has partnered with local, regional, national, and international governments and agencies to provide targeted solutions for challenging problems.
Bio: David Ebert is the Silicon Valley Professor of Electrical and Computer Engineering at Purdue University, a University Faculty Scholar, a Fellow of the IEEE, and Director of the Visual Analytics for Command Control and Interoperability Center (VACCINE), the Visualization Science team of the Department of Homeland Security's Command Control and Interoperability Center of Excellence. Dr. Ebert performs research in novel visualization techniques, visual analytics, volume rendering, information visualization, perceptually-based visualization, illustrative visualization, mobile graphics and visualization, and procedural abstraction of complex, massive data. Ebert has been very active in the visualization community, teaching courses, presenting papers, co-chairing many conference program committees, serving on the ACM SIGGRAPH Executive Committee, serving as Editor in Chief of IEEE Transactions on Visualization and Computer Graphics, serving as a member of the IEEE Computer Society's Publications Board, serving on the IEEE Computer Society Board of Governors, and successfully managing a large program of external funding to develop more effective methods for visually communicating information.
Abstract: Relational data sets are often visualized with graphs: objects become the graph vertices and relations become the graph edges. Graph drawing algorithms aim to present such data in an effective and aesthetically appealing way. We describe map representations, which provide a way to visualize relational data with the help of conceptual maps as a data representation metaphor. While graphs often require considerable effort to comprehend, a map representation is more intuitive, as most people are familiar with maps and ways to interact with them via zooming and panning. Map-based visualization allows us to explicitly group clusters of related vertices as "countries" and to present additional information with contour and heatmap overlays. We consider map representations of the DBLP bibliography server. Words and phrases from paper titles are the cities in the map, and countries are created based on word and phrase similarity, calculated using co-occurrence. With the help of heatmaps, we can visualize the profile of a particular conference or journal over a base map of all computer science. Similarly, we can create heatmap profiles for individual researchers or research groups such as a department. Alternatively, a specific journal or conference can be used to generate the base map and then a series of heatmap overlays can show the evolution of research topics in the field over the years. As before, individual researchers or research groups can be visualized using heatmap overlays but this time over the journal or conference base map. Finally, visual abstracts can be generated from research papers, providing a snapshot view of the topics in the paper. See http://mocs.cs.arizona.edu for more details.
Bio: Stephen Kobourov is a Professor of Computer Science at the University of Arizona. He completed a BS degree in Mathematics and Computer Science at Dartmouth College in 1995, and a PhD in Computer Science at Johns Hopkins University in 2000. He worked for a year at the University of Botswana as a Fulbright Scholar and at the University of Tübingen as a Humboldt Fellow. He has also worked as a Research Scientist at AT&T Research Labs.

Abstract: Since 1492 mapping data on a sphere invokes the authoritative power of the globe.
Worldprocessor (http://worldprocessor.com) may be described as “An attempt to do justice to the term 'political' and 'geo-political' globe. ... Trying to tell the lie (of abstraction and visualization) that tells the truth.”
Data are easily recorded in numbers, however, data do not necessarily come in color or form and shape. There is no such thing as a visual Esperanto.
Almost 100 years ago Robert Flaherty would arrange and stage every scene in his documentaries, because reality and truth need to be created specifically for the medium that documents it. The same is true for any representation media. The pros and cons and challenged of communication by sphere are examined in graphic detail.
The need for for a healthy dose of data skepticism is best expressed in Mark Twain's words: ‘There are lies, damned lies, and statistics’.
Bio: Ingo Günther, born in 1957, grew up in the city of Dortmund, Germany. In the 1970s, travels took him to Northern Africa, North and Central America, and Asia. He studied Ethnology and Cultural Anthropology at Frankfurt University (1977) before he switched to the Kunstakademie Düsseldorf in 1978, where he studied with Schwegler, Uecker, and Paik (M.A. 1983). In the same year, he received a stipend from the Kunstakademie Düsseldorf for a residency at P.S.1 in New York. He received a DAAD grant the following year and a Kunstfonds grant in 1987.
Günther's early sculptural works with video led him towards journalistic projects. Based in New York, he played a role in the evaluation and interpretation of satellite data gathered from political and military crisis zones; the results were distributed internationally through print media and TV news. This work with satellite data led to Günther's contribution to Documenta 8 (1987), the installation K4 (C31) [Command Control Communication and Intelligence]. In the same year, Günther received accreditation as a correspondent at the United Nations in New York.
Since 1988, Günther has used globes as a medium for his artistic and journalistic interests. In early 1990, shortly before the reunification of Germany, he co-founded the first independent TV station in Eastern Europe, Kanal X, Leipzig in order to contribute to the establishment of a free media landscape. More recently, Günther has undertaken large scale digital imaging projects at the 2005 Yokohama Triennial and, in 2011, at Miraikan, the National Museum for Innovation and Emerging Sciences in Tokyo, Japan.

The Scientist and the Journalist: Storytelling with Data Visualization and Infographics
Alberto Cairo
Abstract: This lecture builds bridges between the two cultures that coexist in visualization: that of graphic designers and journalists—interested in presenting concise summaries of data in an engaging way—and that of researchers and scientists—who strive for efficiency, functionality, and complexity. In the past, some experts claimed that these two cultures are irreconciliable, but the truth is that there's much to be gained from an open conversation between them.
Bio: Alberto Cairo is the author of The Functional Art: An Introduction to Information Graphics and Visualization (PeachPit Press, 2012). He teaches infographics and visualization at the School of Communication of the University of Miami since January 2012. Before that, he was director of infographics at Editora Globo, Brazil (2010-2011), James H. Schumaker Term Assistant Professor at UNC-Chapel Hill (2005-2009), and director of online infographics at El Mundo, Spain (2000-2005). His website is thefunctionalart.com.

Abstract: The Deep Web has enabled the availability of a huge amount of useful information and people have come to rely on it to fulfill their information needs in a variety of domains. We present a recent study on the accuracy of data and the quality of Deep Web sources in two domains where quality is important to people's lives: Stock and Flight. We observe that, even in these domains, the quality of the data is less than ideal, with sources providing conflicting, out-of-date and incomplete data. Sources also copy, reformat and modify data from other sources, making it difficult to discover the truth. We describe techniques proposed in the literature to solve these problems, evaluate their strengths on our data, and identify directions for future work in this area.
Bio: Divesh Srivastava is the head of the Database Research Department at AT&T Labs-Research. He received his Ph.D. from the University of Wisconsin, Madison, and his B.Tech from the Indian Institute of Technology, Bombay. He is a fellow of the ACM, and his research interests span a variety of topics in data management.
Divide and Recombine for the Analysis of Large Complex Data
William S. Cleveland
Abstract: Large complex data challenge all of the intellectual components of data science: statistical theory, statistical and machine learning methods, visualization methods, statistical models, computational algorithms, and computational environments. In meeting the challenge we set two goals that have been achieved for small data and that it is critical to preserve. The first is deep analysis: comprehensive analysis, including visualization of the detailed data at their finest granularity, which minimizes the risk of losing important information in the data. The second is a computational environment where an analyst programs exclusively with an interactive language for data analysis such as R, making programming with the data very efficient. D&R (datadr.org) is an approach that seeks to achieve these goals. The data analyst divides the data into subsets and writes them to disk. Then analytic methods are applied to each subset. The analytics are statistical methods whose output is categorical or numeric, and visualization methods whose output is visual. An analytic method is applied to each subset independently of the other subset. Then the outputs of each method are recombined. In our analyses of large complex data the number of subsets have varied from hundreds to millions. D&R computation is almost all embarrassingly parallel: no communication among parallel computations, which is the simplest parallel computation. This is exploited by RHIPE (R and Hadoop Integrated Processing Environment), which means "in a moment in Greek". It is a merger of R and Hadoop that allows a D&R analysis of a large complex dataset to be carried out wholly from within R. For statistical methods applied to the data, D&R estimators have different theoretical properties from the direct whole-data estimators, and are typically less efficient. However, if the division is carried out using statistical thinking (e.g., stratified sampling) to make each subset as representative as possible, then results can be excellent. This is replicate division. In addition, division is also often guided by variables important to the analysis in which it is natural as an analysis strategy to break up the data according to their values. This is conditioning variable division. For visualization methods, the analyst applies a method to each of a number of subsets, typically not to all because there are far too many to view. Instead, statistical sampling is used to select a limited number. The subsets contain the detailed data, so this enables visualization of the data at its finest granularity. While the sampling is a data reduction method, it is a rigorous one that uses the same statistical thinking as survey sampling, but in D&R there is an advantage because all of the data are in hand, which can be exploited in developing a sampling plan.
Bio: William S. Cleveland is the Shanti S. Gupta Distinguished Professor of Statistics and Courtesy Professor of Computer Science at Purdue University. His areas of methodological research are in statistics, machine learning, and data visualization. He has analyzed data sets ranging from small to large and complex in his research in cyber security, computer networking, visual perception, environmental science, healthcare engineering, public opinion polling, and disease surveillance. In the course of this work, Cleveland has developed many new methods and models for data that are widely used throughout the worldwide technical community. Cleveland has led teams developing software systems implementing his methods that have become core programs in many commercial and open-source systems. One example is the trellis display framework for data visualization that initially became a part of the commercial S-Plus environment, and was later incorporated into the R environment as lattice graphics by Deepayan Sarkar. In 1996 Cleveland was chosen national Statistician of the Year by the Chicago Chapter of the American Statistical Association. He is a Fellow of the American Statistical Association, the Institute of Mathematical Statistics, the American Association of the Advancement of Science, and the International Statistical Institute. In 2002 he was selected as a Highly Cited Researcher by the American Society for Information Science & Technology in the newly formed mathematics category. Google Scholar shows 15,756 citations to his books and papers.
| 6:00 PM | Wells Library 001

Abstract: Streaming social media are a prime example of information physicality (location in both space and time) and information sociality. Extension of automated analysis techniques, such as topic modeling and entity extraction, to textual content in these media over time have made these aspects available, organizable, and interpretable. This has resulted in an unprecedented capability to identify events and their aftermaths, infer relationships including potential causes and effects, and tell stories. In addition, related analyses can identify social networks, communities of interest, and how they evolve over time, as well as show how ideas are disseminated through networks and individuals. The result will be a new and much richer way to build social history than was available before, where history is defined in the broadest way to include not only past events but how the present evolves and what all this tells us about the future. In this talk, I will discuss some fundamental work we have done in this area and the applications that have resulted.
Bio: William Ribarsky is the Bank of America Endowed Chair in Information Technology at UNC Charlotte and the founding director of the Charlotte Visualization Center. He is currently Chair of the Computer Science Department. His research interests include visual analytics; 3D multimodal interaction; bioinformatics visualization; sustainable system analytics; visual reasoning; and interactive visualization of large-scale information spaces. Dr. Ribarsky is the former Chair and a current Director of the IEEE Visualization and Graphics Technical Committee. He is also a member of the overall Steering Committees for IEEE VisWeek, which comprises the Scientific Visualization, Information Visualization, and Visual Analytics Conferences, the leading international conferences in their respective fields. He was an Associate Editor of IEEE Transactions on Visualization and Computer Graphics and is currently an Editorial Board member for IEEE Computer Graphics & Applications. Dr. Ribarsky co-founded the Eurographics/IEEE visualization conference series (now called EG/IEEE EuroVis) and led the effort to establish the current Virtual Reality Conference series. For the above efforts on behalf of IEEE, Dr. Ribarsky won the IEEE Meritorious Service Award in 2004. In 2007, he was general co-chair of the IEEE Visual Analytics Science and Technology (VAST) Symposium. Dr. Ribarsky has published over 160 scholarly papers, book chapters, and books. He has received competitive research grants and contracts from NSF, ARL, ARO, DHS, NIH, ONR, EPA, AFOSR, DARPA, NASA, NIMA, US DOT, National Institute of Justice, and several companies.
| 6:00 PM | Wells Library 001

Cities of Tomorrow: Visual Computing for Sustainable Urban Ecosystems
Daniel G. Aliaga
Abstract: Cities are extremely complex ecosystems of human activities for living, working, and entertainment its many inhabitants. In 1900, fourteen percent of the world’s 1.6 billion people lived in cities. Today, more than 50 percent of the world’s 7 billion people live in cities – and that number is only expected to grow over the next decades. Moreover, although cities only occupy two percent of the Earth’s surface, the concentrated presence of man-made structures, the lack of tools for rapidly exploring the effect of different city geometries, and the high-resource consumption severely affect the surrounding environment causing strong and unwanted consequences. In this talk, Dr. Aliaga will describe multi-disciplinary research at Purdue (www.cs.purdue.edu/cgvlab/urban) focused on interactive visual computing tools for improving the complex urban ecosystem and for “what-if” exploration of sustainable urban designs. The projects to be shown provide computing platforms to tightly integrate 3D urban modeling with urban simulation, visualization, meteorology, and vegetation modeling.
Bio: Dr. Daniel G. Aliaga’s research is primarily in the area of 3D computer graphics but overlaps with computer vision and with visualization. He focuses on i) 3D urban modeling (creating novel 3D urban acquisition algorithms, forward and inverse procedural modeling, and integration with urban design and planning), ii) projector-camera systems (focusing on algorithms for spatially-augmented reality and for appearance editing of arbitrarily shaped and colored objects), and iii) 3D digital fabrication (creating novel methods for digital manufacturing that embed into a physical object information for genuinity detection, tamper detection, and multiple appearance generation). Dr. Aliaga has also performed research in 3D reconstruction, image-based rendering, rendering acceleration, and camera design and calibration. To date Prof. Aliaga has published over 80 peer reviewed publications and chaired and served on numerous ACM and IEEE conference and workshop committees, including being a member of more than 40 program committees, conference chair, papers chair, invited speaker, and invited panelist. In addition, Dr. Aliaga has served on several NSF panels, is on the editorial board of Graphical Models, and is a member of ACM SIGGRAPH. His research has been whole or partially funded by NSF, MTC, Microsoft Research, Google, and Adobe Inc.
| 6:00 PM | Wells Library 001

Reframing Recovery: Disciplinary Boundary Maintenance in Mental Health Services
Ann McCranie
Abstract: The concept of recovery in mental health services research refers broadly to the idea that individuals with serious mental illness can get better. This may not seem a revolutionary idea on its face, but for the mental health services research field, it has proven a potent scientific/intellectual movement that has influenced treatment and outcomes research and even policy development over the past 20 years. However, the idea of recovery, which had its origins in "consumer" criticism of the prevailing psychiatric understanding of illnesses such as schizophrenia and bipolar disorder, has no clear and agreed-upon definition within the research field. In the absence of agreement and clarity, the various disciplines and approaches to serious mental illness (such as biomedical psychiatry, psychosocial rehabilitation, and peer services) each have adopted significantly different approaches to what it means to be "recovery-oriented." Using main path and positional analysis, this study investigates the most influential works in the field of recovery research and traces the development since 1993, documenting the ways in which the field of psychiatry has managed to reframe the issue of recovery from its implicit critique of the profession into a new field of "remission" studies.
Bio: Before arriving at Indiana University, I spent several years as a community journalist in the foothills of the Appalachians. As a reporter, one issue among many that I covered was the transformation of the community mental health center model of treatment in North Carolina. This led directly to a research interest in the organization of care and the social integration of individuals living with severe mental illness. Since arriving at IUB's sociology department and working with my mentor and dissertation chair, Bernice Pescosolido, my interests have continued to focus on serious mental illness, but have also expanded into social networks and the sociology of organizations. My dissertation is about the scientific/intellectual movement of "recovery" in mental health services research over the last 20 year in the United States. I take an explicitly networks-driven approach to studying the community of researchers that has emerged around this topic. I am currently the managing editor of a new interdisciplinary journal, Network Science, published by Cambridge University Press and scheduled to begin publication in April 2013. I teach a number of workshops and courses on network analysis, primarily through the ICPSR Summer Program in Quantitative Methods of Social Research.

Atlas of a regional transportation network: Oregon Metro's Mobility Corridor Atlas ~ Draft 1.0
Matthew Hampton
Abstract: Regional transportation networks move goods, services and people across multiple city, village and neighborhood scales using a variety of modes (auto, transit, bike, pedestrian, etc.). Capturing, modeling and displaying this data for planning purposes in the Portland, Oregon metropolitan region resulted in Metro's first Mobility Corridor Atlas. Mobility Corridors are a new way to organize, integrate and understand land use and transportation data. This concept focuses on the region's network of freeways and highways and includes parallel networks of arterial streets, regional multi-use paths, high capacity transit and frequent bus service. The function of this network of integrated transportation corridors is metropolitan mobility and in some corridors, connecting the region with the rest of the state and beyond. Visual techniques to depict land use, traffic flow, volume, speed, capacity, and direction are explored to help policymakers develop strategies that improve mobility in 24 corridors. Also learn how regional bike and pedestrian networks are analyzed to display variations of connectivity, density, permeability, land use, topography, safety, sidewalk completion, tree canopy and potential for version 2.0.
Bio: Matthew Hampton has 15 years of progressive work experience in design cartography and applied geospatial analysis. Born and raised in western Montana, Matthew studied the epistemology of science at Lewis & Clark College in Portland, Oregon and graduated with a degree in Social and Cultural Anthropology. After working as a wilderness guide in the Pacific Northwest, he finished a Master's degree in Geography at Portland State University and joined the Transportation Planning Department at Metro. As a Senior Geodesigner at Metro, Matthew provides analysis, creates maps, visualizations and infographics of transportation networks to guide the region's growth and development. He currently serves on the board of the North American Cartographic Information Society (NACIS).
| 6:00 PM | Wells Library 001
Advanced Network Analysis and Visualization: Hierarchical Networks using Sci2 and OSLOM
Ted Polley
Abstract: This hands-on session introduces the Blondel community detection algorithm and the circular hierarchy network visualization together with the multifunctional algorithm package OSLOM (www.oslom.org) that handles edge directions, edge weights, overlapping communities and hierarchies.
Bio: Ted Polley is a Research Assistant at the Cyberinfrastructure for Network Science (CNS) Center. He recently obtained a dual Master’s degree in Library and Information Science from the School of Library and Information Science at Indiana University. He has extensive experience testing and documenting the information visualization software programs developed at CNS and serves as a professional contributor to research, performing software testing and documentation, and responding to user questions.

Abstract: The adoption of online social media to ease communication related to politics, policy and social protest has recently emerged as a prominent social phenomenon. Online social media have played important roles in social and political upheaval, such as the 2009 Arab Spring. By analyzing a high-volume, fifteen-month long dataset captured from Twitter, we provide a quantitative perspective on the birth and evolution of the US anti-capitalist movement known as Occupy Wall Street. Our analysis inspects individuals engagement, patterns of activity and social connectivity to investigate changes in online user behavior looking at participant interests and relations before, during and after the Occupy movement. In this talk I will show that Occupy has elicited participation mostly of users with pre-existing interests in domestic politics and foreign social movements. Occupy went through a short initial "explosive" phase, with high peaks of activity, and a dramatic decrease of volume shortly after. Online activity was strongly correlated with "on the ground" events, focused on organizational aspects more than collective framing. After the "high-activity" phase of the movement, we observe that user inter-connectivity and interests have remained mostly unchanged.
Bio: Emilio Ferrara is a Post-doctoral fellow at the School of Informatics and Computing of IU Bloomington. He works with A. Flammini and F. Menczer on a DARPA research project aiming at the detection of political abuse on social media. He received a PhD in Mathematics and Computer Science from University of Messina, Italy in 2012. During 2010 he was a visiting scholar at the Database and Artificial Intelligence group of Vienna University of Technology and an intern at Lixto GmbH; during 2011 and 2012 he was a visiting researcher at the Centre for Systems and Synthetic Biology of the Royal Holloway University of London. His research interests include social network and media analysis, knowledge engineering, machine learning, bio-informatics and algorithms. He has co-authored over 30 papers, appeared in PLoS One, Information Sciences, Knowledge-based Systems, Journal of Computer and System Sciences, EPJ Data Science, CIKM, and other prestigious venues.

Automatic Construction of Topic Maps for Navigation in Information Space
ChengXiang Zhai
Abstract: Querying and browsing are two complementary ways of finding relevant information items in an information space. Querying works well when a user has a clear goal of information seeking and knows how to formulate an effective query, whereas browsing is more useful when a user has a vague (exploratory) information need, or when a user cannot easily formulate an effecive query. Although users can freely query any information space by using a search engine, they only have very limited support for browsing, which currently can only be done based on manually generated links or category hierarchies. In order to freely browse an information space, users would need a more comprehensive topic map that can connect and organize all the information items in a meaningful way. Unfortunately, manual construction of such a topic map is labor-intensive and thus does not scale up well. In this talk, I will present two case studies of automatically constructing a topic map to enable effective browsing. In the first, we propose to view the search log data naturally available for an operational search system as the information footprints left by users and organize search logs into a multiresolution topic map, which enables a user to follw the footprints left by previous users to explore information flexibly. As new users use the map for navigation, they leave more footprints, which can then be used to enrich and refine the map dynamically and continuously for the benefit of future users, leading to a sustainable infrastructure to facilitate users to surf the information space in a collaborative manner. In the second, we develop probabilistic generative models to extract topics in text collections and connect them into various topic maps that can represent the information space from different perspectives. Such maps reveal interesting topic patterns buried in the text data and enable users to flexibly follow topic patterns and navigate into detailed information about each topic. In the end of the talk, I will discuss some challenges to be solved in order to seamlessly integrate querying and browsing to support multi-mode information seeking and analysis.
Bio: ChengXiang Zhai is an Associate Professor of Computer Science at the University of Illinois at Urbana-Champaign, where he also holds a joint appointment at the Graduate School of Library and Information Science, Institute for Genomic Biology, and Department of Statistics. He received a Ph.D. in Computer Science from Nanjing University in 1990, and a Ph.D. in Language and Information Technologies from Carnegie Mellon University in 2002. He worked at Clairvoyance Corp. as a Research Scientist and a Senior Research Scientist from 1997 to 2000. His research interests include information retrieval, text mining, natural language processing, machine learning, and biomedical informatics. He is an Associate Editor of ACM Transactions on Information Systems, and Information Processing and Management, and serves on the editorial board of Information Retrieval Journal. He is a program co-chair of ACM CIKM 2004, NAACL HLT 2007, and ACM SIGIR 2009. He is an ACM Distinguished Scientist and the recipient of multiple best paper awards, UIUC Rose Award for Teaching Excellence, an Alfred P. Sloan Research Fellowship, IBM Faculty Award, HP Innovation Research Program Award, and Presidential Early Career Award for Scientists and Engineers (PECASE).

Topical Analysis and Visualization of (Network) Data using Sci2
Ted Polley
Abstract: This hands-on session introduces topical analysis and visualization of network data. Specifically, we will use the Sci2 tool to extract co-word occurrence networks and to generate science map overlays.
Bio: Ted Polley is a Research Assistant at the Cyberinfrastructure for Network Science (CNS) Center. He recently obtained a dual Master’s degree in Library and Information Science from the School of Library and Information Science at Indiana University. He has extensive experience testing and documenting the information visualization software programs developed at CNS and serves as a professional contributor to research, performing software testing and documentation, and responding to user questions.


