Open House 2015
Publications | Visualizations | Humanexus | Events | Development | Exhibit | IVMOOC | News | Funding
Monday, November 30, 4:00-6:00 pm
Slides
Each year, we invite our friends and colleagues to join us for two hours of enlightening talks, hands-on demos, snacks, and drinks. We work hard to make our open house a fun and educational soirée where guests are free to roam about, explore our visualizations, and of course ask questions!
This year's open house will be held at the Social Science Research Commons (SSRC) in Woodburn Hall, near the intersection of E. 7th St. and N. Forrest Ave.
View the talks here.
We'd like to thank all who joined us for this year's Open House, and to all who presented their work. We enjoyed spending time with you all, and sharing the work we've been doing over the past year and the ideas that will guide our future endeavors.
PUBLICATIONS
- Goldstone, Robert, Franco Pestilli, and Katy Börner. 2015. "Self-portraits of the brain: cognitive science, data visualization, and communicating brain structure and function". Trends in Cognitive Sciences doi:10.1016.
- Jibu, Mari, Gregory O'Hare, and Katy Börner. 2015. "Knowledge Flows and Delays in the Pharmaceutical Innovation System". 15th International Conference on Scientometrics and Informetric 877-878.
- Patel, Kishor, Sergio Govoni, Ashwini Athavale, Robert Light, and Katy Börner. 2015. "ProQuest Dissertation Analysis". 15th International Conference on Scientometrics and Informetric 292-293.
- Börner, Katy, Joe E. Heimlich, Russell Balliet, and Adam V. Maltese. 2015. "Investigating Aspects of Data Visualization Literacy Using 20 Information Visualizations and 273 Science Museum Visitors". Information Visualization 1-16.
- Saket, Bahador, Carlos Scheidegger, Stephen Kobourov, and Katy Börner. 2015. "Map-based Visualizations Increase Recall Accuracy of Data". EUROGRAPHICS 2015, 441-450.
- Larivière, Vincent, Stefanie Haustein, and Katy Börner. 2015. "Long-Distance Interdisciplinarity Leads to Higher Scientific Impact". PLOS ONE DOI: 10.1371.
- Börner, Katy. 2015. Atlas of Knowledge: Anyone Can Map. Cambridge, MA: The MIT Press.
- Murdock, Jaimie, Robert Light, Colin Allen, and Katy Börner. 2014. "Mapping the Intersection of Science & Philosophy". In Proceedings of 13th ACM/IEEE-CS Joint Conference on Digital Libraries, 405-406. New York: ACM.
- Boyack, Kevin W., and Katy Börner, eds. 2014. "Mapping Science". BULLETIN of the Association for Information Science and Technology 41 (2).
- Börner, Katy, Todd Theriault, and Kevin W. Boyack. 2014. "Mapping Science: Past, Present and Future". BULLETIN of the Association for Information Science and Technology 41 (2): 12-16.
- Stipelman, Brooke, Kara L. Hall, Angela Zoss, Janet Okamoto, Daniel Stokols, and Katy Börner. 2014. "Mapping the Impact of Transdisciplinary Research: A Visual Comparison of Investigator Initiated and Team Based Tobacco Use Research Publications". The Journal of Translational Medicine and Epidemiology 2 (2): 1033.
- Hook, Peter A. 2014. "The Structure and Evolution of The Academic Discipline of Law In The United States: Generation and Validation of Course-Subject Cooccurrence (CSCO) Maps". Thesis, Doctor of Philosophy in Library and Information Science: Katy Börner (Chair), Staša Milojevic, Cassidy Sugimoto, Jonathan Plucker, William Henderson. Indiana University, Bloomington. Indiana University, Bloomington.
INFORMAL PUBLICATIONS
- Börner, Katy, Russell Balliet, Adam V. Maltese, Stephen Miles Uzzo, and Joe E. Heimlich. 2015. "Meaning Making Through Data Representation Construction and Deconstruction" . AERA 2015 Annual Meeting.
- Wojton, Mary Ann, Joe E. Heimlich, Alexandra Burris, and Zdanna Tramby. 2014. "Big Data Insight Needs Sort ". Formative Evaluation Study, Indiana University 12.
- Heimlich, Joe E., Zdanna Tramby, and Mary Ann Wojton. 2014. "Sense Making of Big Data ". Front-end study on familiarity with terms, Indiana University 7.
- Wojton, Mary Ann, Sasha Palmquist, Victor Yocco, and Joe E. Heimlich. 2014. "Meaning making through data representation Construction and Deconstruction". Findings from COSI, Koshland, New York Hall of Science, and Wonder Lab, Indiana University 41.
VISUALIZATIONS
NETE A/V Tool
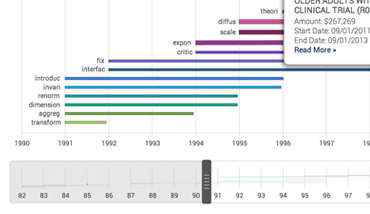
In August 2014, our development team finished an NIH-funded SBIR Phase II project that resulted in a major overhaul of the NETE Analyzer/Visualizer, a web-based data visualization tool originally developed in 2012 and used by NIH program officers.
The all-new responsive interface scales effortlessly from desktop to tablet browsing and boasts several new features aimed at optimizing a variety of visualization types for effective communication of the insights inherent in the data.
It is highly interactive, empowering users to pinch-zoom and pan, search and filter, and click individual nodes to access detailed information. A full-screen option and hide-and-show legend window have been added to give users the cleanest and largest possible view of their data.
The project effectively converts existing Sci2 tool visualizations such as temporal bar graphs, geospatial maps, science maps, and network visualizations into online web services. In the second year, two new visualizations will be added.
HUMANEXUS RECEIVES ACCOLADES
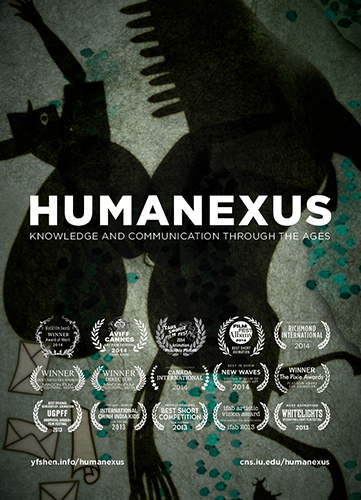 Humanexus: Knowledge and Communication through the Ages is the product of a close collaboration between animator Ying-Fang Shen, Katy Börner, and composer and sound designer Norbert Herber, a senior lecturer in Indiana University’s Department of Telecommunications. The film tracks the evolution of human communication from cave scrawls to Twitter feeds, offering a unique depiction of the ever-accelerating spread of information and communication over the course of human history.
The film has garnered worldwide acclaim since its release in 2013, most recently winning the Audience Award at the 2014 Short@ Fringe at Azores Fringe Festival in Azores, Portugal, the Award of Merit at theWorld Film Awards in Jakarta, Indonesia, and Third Prize at the Aviff Cannes Art Film Festival in Cannes, France. See the impressive full list of awards here. Such accolades serve as testimony to both the relevance of the film’s message and the artistic vision through which Shen conveys that message.
You can watch the trailer for Humanexus here and learn more about the production of the film and its accolades here.
EVENTS
Workshops
- Visual Analytics in Healthcare
November 02, 2015 - November 03, 2015 | Bloomington, Indiana - Plug-and-Play Macroscopes: Modular Hardware and Software Platforms that Render Data into Insights
October 17, 2015 | Montreal, Canada - Forecasting science: Models of science and technology dynamics for innovation policy
June 29, 2015 | Istanbul, Turkey - Visual Insights from Big Data: Envisioning Science, Engineering, and Innovation
February 12, 2015 - February 16, 2015 | San Jose, California
Sci2 Tutorials
- Open Source Tools for S&T Data Analysis and Visualization
Monday, June 29, 2015 | Istanbul, Turkey
CYBERINFRASTRUCTURES DEVELOPED

Cyberinfrastructure Shell (CIShell)
cishell.org
CIShell integration partner
textrend.org
VIVO
vivoweb.org

Network Workbench (NWB)
nwb.cns.iu.edu

Science of Science Cyberinfrastructure and Sci2 Tool
sci2.cns.iu.edu
Scholarly Database (SDB)
sdb.cns.iu.edu

Epidemics Cyberinfrastructure (EpiC)
epic.cns.iu.edu
MAPSustain

National Gene Vector Biorepository
ngvbcc.org/GeographicMap.action
PLACES & SPACES EXHIBIT
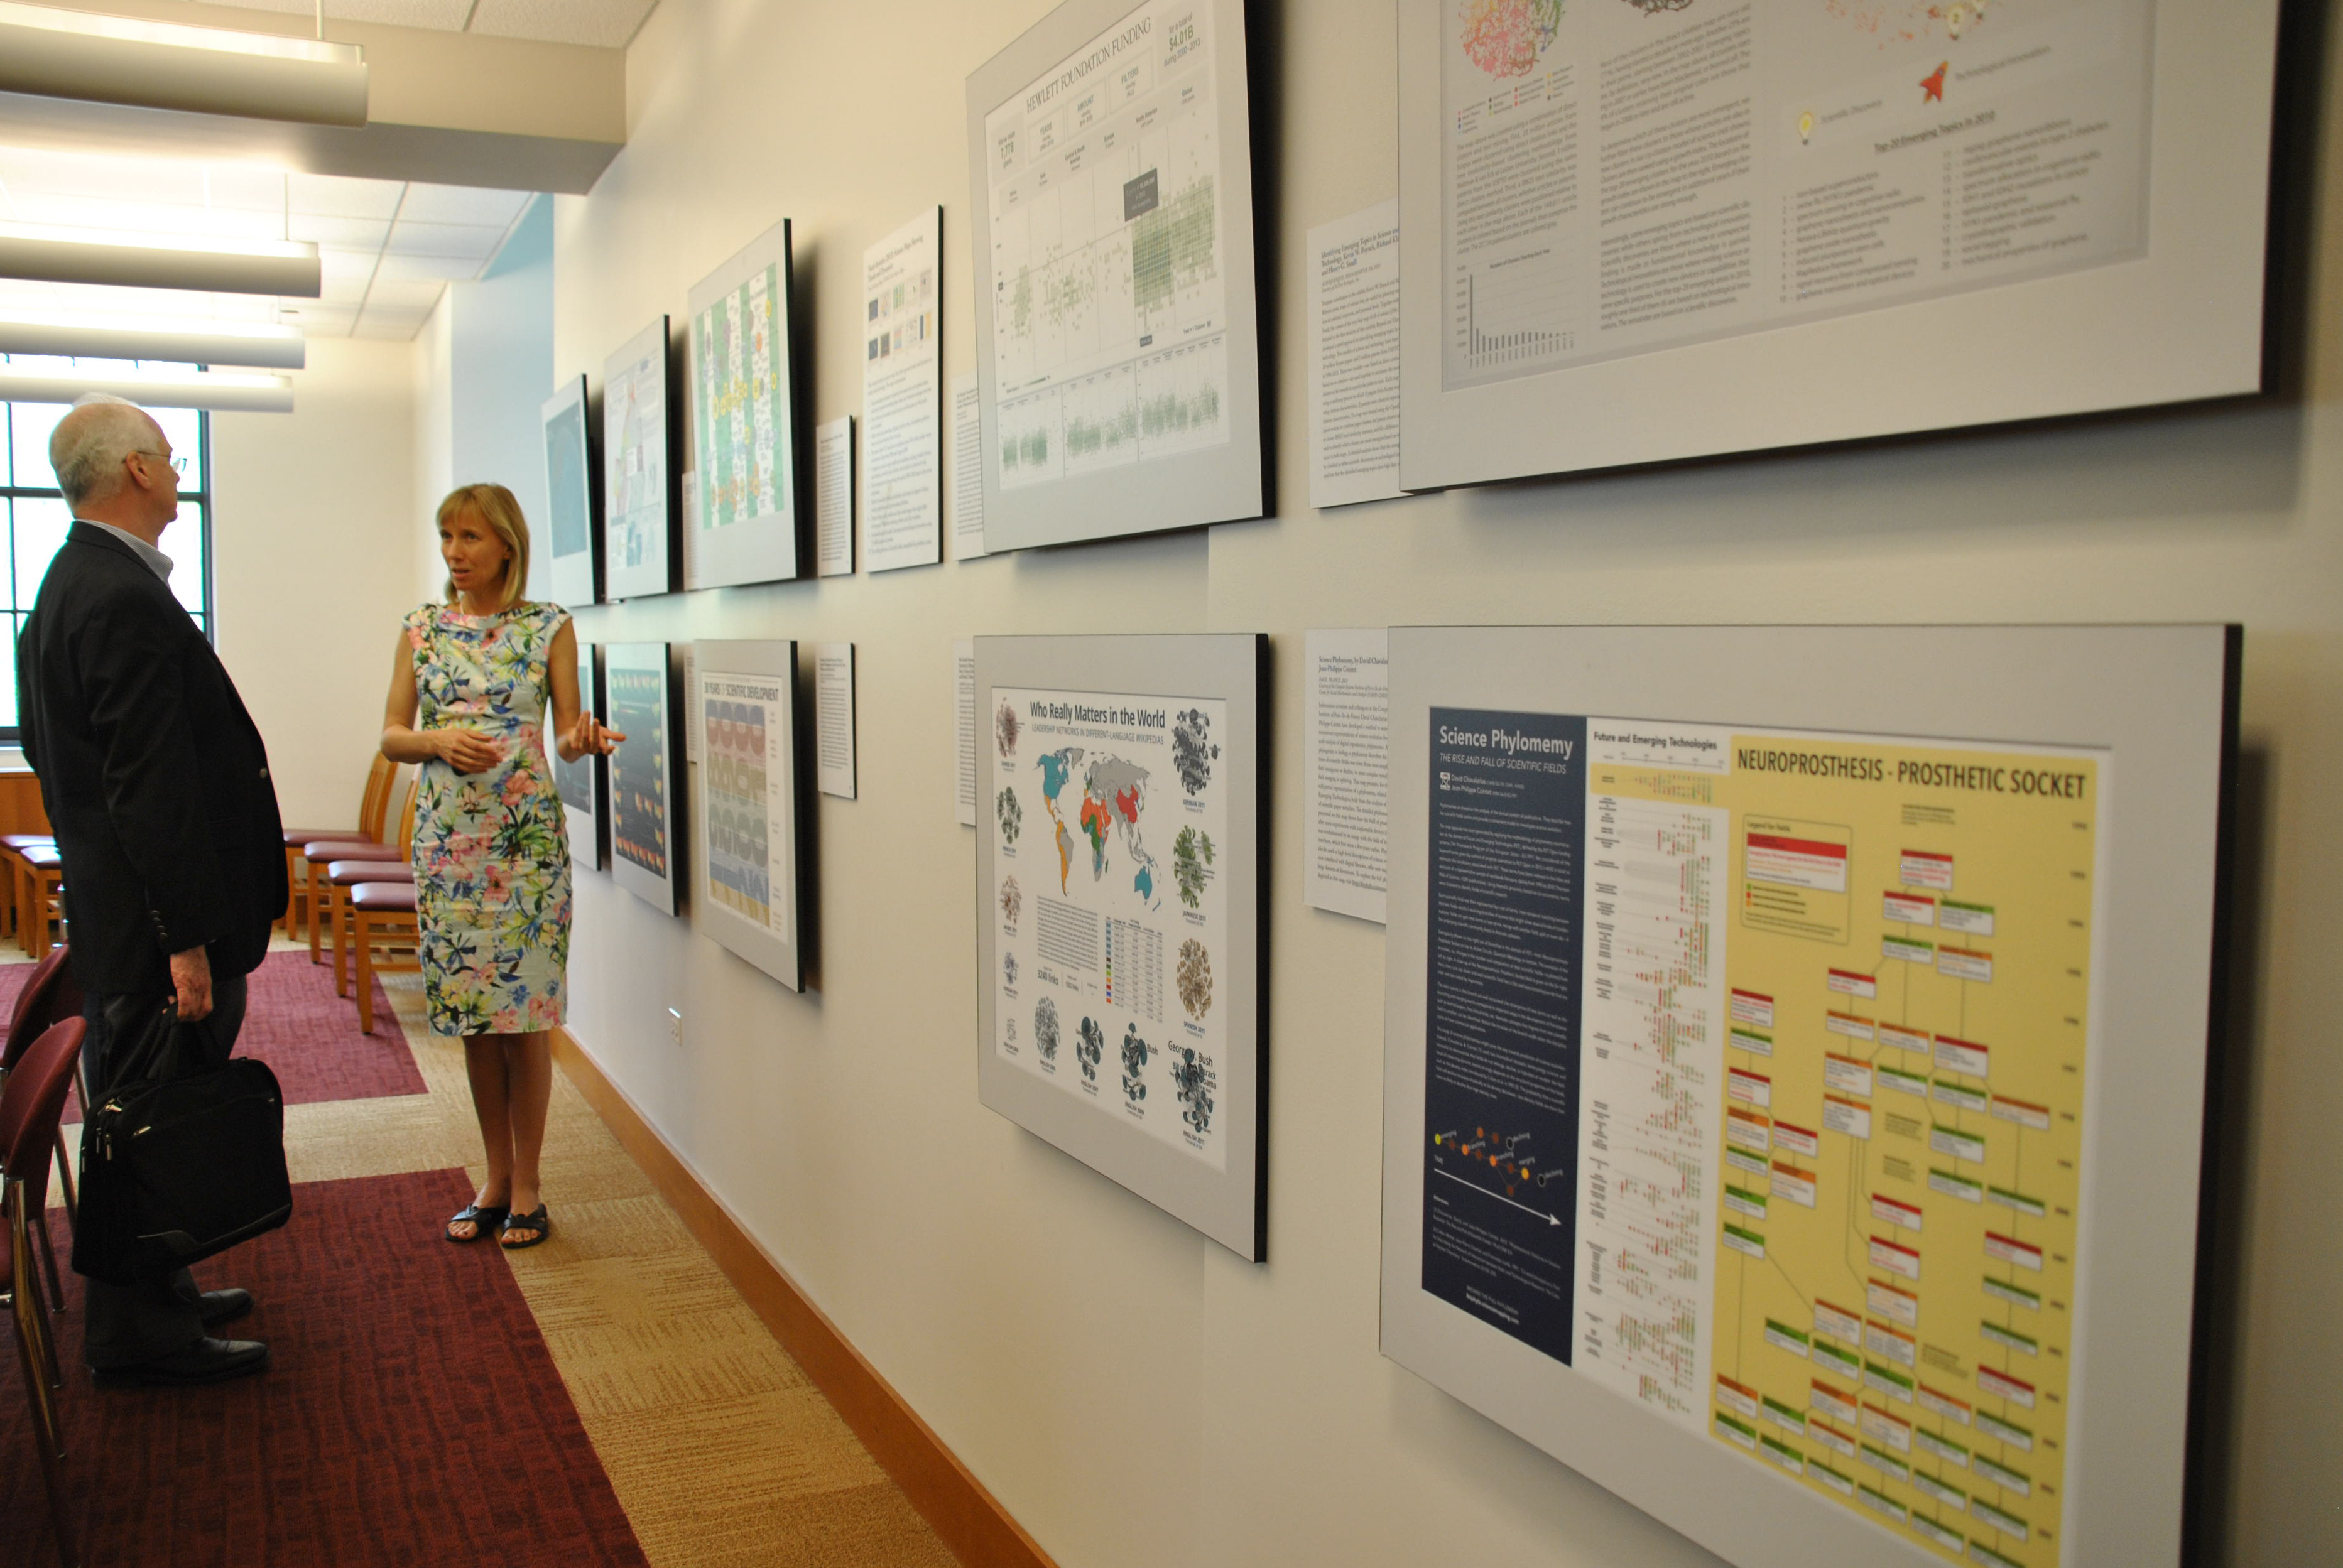
After ten years of bringing maps of science to the general public, the Places & Spaces exhibition has taken a leap into the world of interactive macroscopes - visualization tools that empower visitors to see data in new ways. The exhibit will soon be rolling out the first four macroscopes, many of which have already garnered praise for their clarity, beauty, and technical innovation. These are only the first of many, as the exhibit’s mission for the next 10 years is to recognize and share best examples of these interactive tools.
The exhibit is just completing an installation at Northwestern University, and will soon be in transition to Atlanta where it opens at the Centers for Disease Control in January.
Photograph courtesy of Northwestern University.
IVMOOC
The 2015 Information Visualization MOOC final exam closed on March 9, 2015. Of the 122 students who took the exam, 77 scored 80% or above (63.1%), and the median score was 85.21%. This marks a substantial improvement in participation over the previous year.
Instructor Michael Ginda attributes the improvements in student participation and engagement with the transition to the Canvas learning management system. "The platform transition gave our team the opportunity to introduce new videos from leading information visualization researchers, improve student discussions forums, and helped instructors reach out to students more effectively," he said.
After the final exam, participants moved into the client project portion of the course, joining together to form groups of 4-5 participants with varied skill sets and choosing from this list of potential projects.
"This year we've been able to curate our largest and most diverse group of real world client projects to cater to our student's interests and needs," Ginda said.
Over the final weeks, the teams were guided through the processes of data collection, cleaning, analysis, and presentation, and went through a week of peer review and feedback before submitting their final projects for grading.
As part of the final project, students in Indiana University – Bloomington's residential section presented client projects results at the Cyberinfrastructure Building's IQ Wall, which may be viewed here.
NEWS FROM THE YEAR
2015
"Atlas of Knowledge: Anyone Can Map" featured in De Ingenieur
August 18, 2015 | MAA Press
"Atlas of Knowledge: Anyone Can Map" reviewed by MAA Press
June 18, 2015 | MAA Press
Rikke Schmidt Kjærgaard applauds a cogent guide to scientific cartography
April 16, 2015 | Nature
U.S. Secretary of Commerce Penny Pritzker Announces Top Data Leaders to Join New Data Advisory Council
March 04, 2015 | SoIC News
"Atlas of Knowledge" featured in MIT Press Journal
Spring 2015 | MIT Press
Speed-Networking: A study on the formation of academic partnerships and the best ways to ignite them
February 26, 2015 | Indiana University Department of Psychological and Brain Sciences
Börner Appointed to U.S. Department of Commerce - Data Advisory Council
February 18, 2015 | IU Newsroom
IU brings broad contingent to AAAS, nation's largest general science meeting
February 12, 2015 | IU Newsroom
Places & Spaces on Exhibit at Duke University
January 30, 2015 | SoIC News
KOFAC International Conference on Science and Creativity - Seoul
January 30, 2015 | SoIC News
2014
NSF awards IU $6.6 million to build Jetstream, a cloud for science and engineering research
November 24, 2014 | SoIC News
New Book: Scholarly Metrics under the Microscope
November 19, 2014 | SoIC News
A Practical Guide to Making Sense of Big Data
November 12, 2014 | SoIC News
IU adds data science master's degree to keep pace with growing big data job demands
October 30, 2014 | SoIC News
Online version of AcademyScope now available on the National Academies Press website
October 27, 2014 | CNS News
Indiana University investing $7 million for new complexity institute
October 23, 2014 | IUPUI Newsroom
FUNDING
Grants & Awards
- Innovation in an Aging Society. Econ P01 National Bureau of Economic Research (Bruce Weinberg, Gerald Marschke, and Katy Börner, $650,000) 2013.09.01 - 2018.08.31.
- SMS-VAT: A Scalable Multi-Scale Visual Analytical Tool. NIH/NCAT (Katy Börner, $300,000) 2014.09.01 - 2016.07.30.
- Visualizing healthcare system dynamics in biomedical Big Data. NIH 1U01CA198934-01 (Griffin Weber, and Katy Börner, $537,387) 2015.06.01 - 2018.05.31.
- Network for Computational Nanotechnology Cyber Platform. NSF 1227110 (Gerhard Kilmeck, $13,799,392) 2012.12.01 - 2017.11.30.
- Conference on Modelling Science, Technology, and Innovation, May 2016. NSF 1546824 Award (Katy Börner, and Stasa Milojevic, $48,750) 2015.09.01 - 2016.08.31.
- MOOC Visual Analytics. Tides Foundation (Katy Börner, $50,000) 2015.04.03 - 2016.08.31.
- Monitoring, Modeling, and Forecasting Tools for Fostering an Innovative S&T Workforce. NIH U01 GM098959-01 Award (Katy Börner, and James P. Crutchfield, $746,758) 2011.09.01 - 2015.08.31.
- Visualizing Biomedical Research Characteristics. NIH/SBIR (Katy Börner, $400,282) 2013.09.01 - 2015.08.31.
- Pathways: Sense-Making of Big Data. NSF ISE DRL-1223698 Award (Katy Börner, Adam V. Maltese, Joe E. Heimlich, Stephen Miles Uzzo, Paul Martin, and Sasha Palmquist, $250,000) 2012.07.01 - 2015.06.30.
Contracts
- Biotechnology and Biological Sciences Research Council, UK: Introducing the Science of Science (Sci2) Tool, Topic Modeling, Data Visualization, Interactive Interface Design