Open House 2014
Publications | Visualizations | Humanexus | Events | Development | Exhibit | IVMOOC | News | Funding
Tuesday, November 4, 4:00-6:00 pm
Slides
Each year, we invite our friends and colleagues to join us for two hours of enlightening talks, hands-on demos, snacks, and drinks. We work hard to make our open house a fun and educational soirée where guests are free to roam about, explore our visualizations, and of course ask questions!
This year's open house will be held at the Social Science Research Commons (SSRC) in Woodburn Hall, near the intersection of E. 7th St. and N. Forrest Ave.
If you're unable to attend the open house in person, we will be streaming it live. Click here around 4:00 pm on November 4 to access the live stream.
PUBLICATIONS
- Saket, Bahador, Paolo Simonetto, Stephen Kobourov, and Katy Börner. 2014. "Node, Node-Link, and Node-Link-Group Diagrams: An Evaluation". IEEE Visual Analytics Science and Technology, IEEE Information Visualization, and IEEE Scientific Visualization.
- Börner, Katy. 2014. "Plug-and-Play Macroscopes: Network Workbench (NWB), Science of Science Tool (Sci2), and Epidemiology Tool (Epic)". In Encyclopedia of Social Network Analysis and Mining. Springer Verlag.
- Light, Robert, Jaimie Murdock, Colin Allen, and Katy Börner. 2014. "Challenges and Opportunities of the UCSD Map of Science‐Library of Congress Crosswalk". VIVO/SciTS 2014 Conference.
- Kulanthaivel, Anand, Josette F. Jones, Robert Light, Katy Börner, and Chin Hua Kong. 2014. "Neurological Disorders and Publication Abstracts Follow Social Network-Type Node Patterns When Indexed Using Ontology Tree-Based Key Term Search". HCI International 2014.
- Bollen, Johan, David Crandall, Damion Junk, Ying Ding, and Katy Börner. 2014. "From funding agencies to scientific agency: Collective allocation of science funding as an alternative to peer review". EMBO Reports 15 (1): 1-121.
- Light, Robert, David E. Polley, and Katy Börner. 2014. "MOOC Visual Analytics: Empowering Teachers, Students, Researchers, and Developers of Massively Open Online Courses". LAK 2014.
- Light, Robert, David E. Polley, and Katy Börner. 2014. "Open Data and Open Code for Big Science of Science Studies". Scientometrics.
- Börner, Katy, and David E. Polley. 2014. "Replicable Science of Science Studies". In Measuring Scholarly Impact - Methods and Practice, edited by Ding, Ying, Ronald Rousseau, and Dietmar Wolfram, Ch. 12. Springer Verlag.
- Börner, Katy, and David E. Polley. 2014. Visual Insights: A Practical Guide to Making Sense of Data. Cambridge, MA: The MIT Press.
- Schreiber, Falk, Andreas Kerren, Katy Börner, Hans Hagen, and Dirk Zeckzer. 2014. "Heterogeneous Networks on Multiple Levels". Information Visualization - Towards Multivariate Network Visualization (Dagstuhl Seminar 13201). Springer Verlag.
- Reijnhoudt, Linda, Rodrigo Costas, Ed Noyons, Katy Börner, and Andrea Scharnhorst. 2014. "‘Seed+Expand’: A general methodology for detecting publication oeuvres of individual researchers". Scientometrics.
VISUALIZATIONS
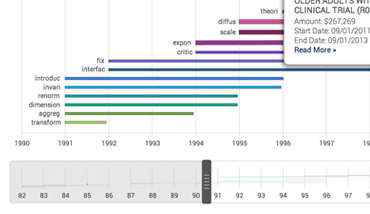
BBSRC Grant Visualizer
At the end of 2013, CNS delivered an online research funding visualizer for the United Kingdom's Biotechnology and Biological Sciences Research Council (BBSRC).
BBSRC (based in Swindon, England) has a unique and central place in supporting the UK's world-leading position in bioscience. With a budget of £467M in 2012-13, the council is a major investor in research and training. Their goals are to further scientific knowledge, to promote economic growth, wealth, and job creation, and to improve the quality of life in the UK and beyond.
The new web-based interface is designed to allow BBSRC research managers to visualize their portfolio across specific topics, universities, and other research organizations' funding mechanisms. They can visualize the data year-by-year, or as an animation of funding allocations over time.
The front end of the application takes advantage of jQuery and the D3.js Javascript library, which was used to iterate through the datasets and render high-quality SVG graphs. Our approach allowed us to provide a unified experience across most browsers, and the use of SVG and intelligent styling allow for scaling to almost any screen size.
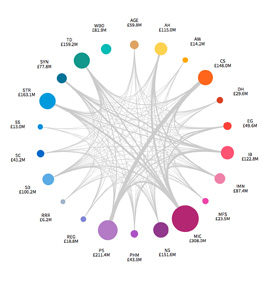
NETE A/V Tool
In August 2014, our development team finished an NIH-funded SBIR Phase II project that resulted in a major overhaul of the NETE Analyzer/Visualizer, a web-based data visualization tool originally developed in 2012 and used by NIH program officers.
The all-new responsive interface scales effortlessly from desktop to tablet browsing and boasts several new features aimed at optimizing a variety of visualization types for effective communication of the insights inherent in the data.
It is highly interactive, empowering users to pinch-zoom and pan, search and filter, and click individual nodes to access detailed information. A full-screen option and hide-and-show legend window have been added to give users the cleanest and largest possible view of their data.
The project effectively converts existing Sci2 tool visualizations such as temporal bar graphs, geospatial maps, science maps, and network visualizations into online web services. In the second year, two new visualizations will be added.
HUMANEXUS RECEIVES ACCOLADES
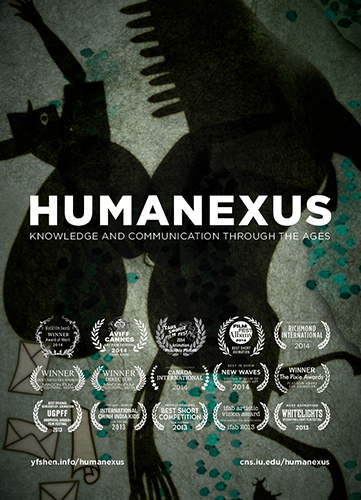 Humanexus: Knowledge and Communication through the Ages is the product of a close collaboration between animator Ying-Fang Shen, Katy Börner, and composer and sound designer Norbert Herber, a senior lecturer in Indiana University’s Department of Telecommunications. The film tracks the evolution of human communication from cave scrawls to Twitter feeds, offering a unique depiction of the ever-accelerating spread of information and communication over the course of human history.
The film has garnered worldwide acclaim since its release in 2013, most recently winning the Audience Award at the 2014 Short@ Fringe at Azores Fringe Festival in Azores, Portugal, the Award of Merit at theWorld Film Awards in Jakarta, Indonesia, and Third Prize at the Aviff Cannes Art Film Festival in Cannes, France. See the impressive full list of awards here. Such accolades serve as testimony to both the relevance of the film’s message and the artistic vision through which Shen conveys that message.
You can watch the trailer for Humanexus here and learn more about the production of the film and its accolades here.
EVENTS
Workshops
- Plug-and-Play Macroscopes Workshop
November 03, 2014 - November 04, 2014 | Bloomington, Indiana - PEGASCIS Scoping Meeting Platform for Enhancing Global Academic Strategic Collaboration in Science
July 21, 2014 | Washington DC - Linking International Databases to Build Strategic Academic Partnerships in Science Workshop
May 14, 2014 - May 15, 2014 | Washington DC - OECD-experts dialogue on scientometrics: Improving the use of bibliometric indicators and analysis for policy-making
March 25, 2014 | Paris, France
Sci2 Tutorials
- Open Source Tools for S&T Data Analysis and Visualization
Wednesday, June 25, 2014 | Paris, France - “Sci2: A Tool for Science of Science Research and Practice"
Wednesday, June 18, 2014 | Adelphi, MD
CYBERINFRASTRUCTURES DEVELOPED

Cyberinfrastructure Shell (CIShell)
cishell.org
CIShell integration partner
textrend.org

VIVO
vivoweb.org

Network Workbench (NWB)
nwb.cns.iu.edu

Science of Science Cyberinfrastructure and Sci2 Tool
sci2.cns.iu.edu

Scholarly Database (SDB)
sdb.cns.iu.edu

Epidemics Cyberinfrastructure (EpiC)
epic.cns.iu.edu
MAPSustain

National Gene Vector Biorepository
ngvbcc.org/GeographicMap.action
PLACES & SPACES EXHIBIT
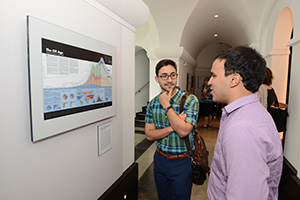
For the first time ever all 100 maps are on display as the 10-year Places & Spaces journey culminates with a beautiful array at the University of Miami. The ten new maps continue the exhibit’s commitment to bringing audiences the most stunning and groundbreaking examples of data visualization from the most brilliant mapmakers of our time.
Half of the 100 visualizations are displayed at the Stanley and Jewell Glasgow Hall in the Perez Architecture Center. The other half, and all the 3D and interactive elements, are on the first and second floors of the Otto G. Richter Library. A series of seminars and other events are being held throughout the Fall semester all over campus.
IVMOOC
The 2014 Information Visualization MOOC final exam closed on March 17, 2014. Of the 82 students who took the exam, 63 scored 80% or above (76.8%), and the median score was 94.1%. This marks a substantial improvement, both in participation and performance, over the previous year.
Instructor Scott Weingart wasn't surprised by the results. "Our students this year are very dedicated, especially those who are going for course credit," he said.
After the final exam, participants moved into the client project portion of the course, joining together to form groups of 4-5 participants with varied skill sets and choosing from this list of potential projects.
"It's exciting how many humanistic and social scientific data sets there are, which really caters to students of all interests," Weingart said.
Over the final weeks, the teams were guided through the processes of data collection, cleaning, analysis, and presentation, and went through a week of peer review and feedback before submitting their final projects for grading.
To see some of the great work IVMOOC students did during the 2014 course, search #ivmooc on Twitter.
NEWS FROM THE YEAR
Peter Hook (Ph.D. 2014) – now Assistant Professor
September 30, 2014 | SoIC News
After 10 years and 100 maps, IU-based 'Mapping Science' project winds down with biggest show ever
September 08, 2014 | IDS News
Katy Börner invited to speak at 2014 VIVO Conference
August 04, 2014 | CNS News
Current and Former ILS Students Receive ‘Best Student Entry’ for Data Visualization Challenge at 2014 ACM Web Science conference
July 10, 2014 | Heather Edelblute | SoIC News
Currents 2014 New Media Festival Preview
June 01, 2014 | Ellen Berkovitch | AdobeAirstream
Registration open for VIVO Conference 2014
May 27, 2014 | CNS News
IU collaborators screening 'Humanexus' at Cannes Film Festival
May 14, 2014 | IU Newsroom
IU collaborators screening 'Humanexus' at Cannes Film Festival (Indiana University Bloomington)
May 14, 2014 | World News Network
SOIC Professor Börner Co-Organizes Conference on International Collaboration
May 13, 2014 | Todd Theriault | CNS News
UM to host ‘Places & Spaces: Mapping Science’ visualization exhibit
May 01, 2014 | Alberto Cairo | University of Miami
UK Research Council funding data comes to life in two new visualisations
April 29, 2014 | British Library
Explore Community and Life Mapping at WonderLab on First Friday Evening
March 31, 2014 | Wonderlab
Visualising Research: using data visualisation to explore how research is funded in the UK
March 04, 2014 | James Douglas | STM Publishing News
Humanexus wins four more awards at three film festivals
March 04, 2014 | CNS News
IU's Börner has full agenda during AAAS, where five from IU will be honored
February 11, 2014 | IU Newsroom
Making Every Scientist a Research Funder
February 07, 2014 | Jeffrey Mervis | Science
Mapping the Unseen: Science Film Showcase - Chicago
February 05, 2014 | ILS News
FUNDING
Grants & Awards
- Innovation in an Aging Society. Econ P01 National Bureau of Economic Research (Bruce Weinberg, Gerald Marschke, and Katy Börner, $650,000) 2013.09.01 - 2018.08.31.
- SEAD Sustainable Environment Through Actionable Data. NSF OCI-0940824 DataNet award (Margaret Hedstrom, Myron P. Gutmann, Praveen Kumar, Jim Myers, and Beth Plale, $188,432) 2011.10.01 - 2016.09.30.
- SMS-VAT: A Scalable Multi-Scale Visual Analytical Tool. NIH/NCAT (Katy Börner, $300,000) 2014.09.01 - 2016.07.30.
- Monitoring, Modeling, and Forecasting Tools for Fostering an Innovative S&T Workforce. NIH U01 GM098959-01 Award (Katy Börner, and James P. Crutchfield, $746,758) 2011.09.01 - 2015.08.31.
- Visualizing Biomedical Research Characteristics. NIH/SBIR (Katy Börner, $400,282) 2013.09.01 - 2015.08.31.
- Pathways: Sense-Making of Big Data. NSF ISE DRL-1223698 Award (Katy Börner, Adam V. Maltese, Joe E. Heimlich, Stephen Miles Uzzo, Paul Martin, and Sasha Palmquist, $250,000) 2012.07.01 - 2015.06.30.
Contracts
- Biotechnology and Biological Sciences Research Council, UK: Introducing the Science of Science (Sci2) Tool, Topic Modeling, Data Visualization, Interactive Interface Design
- ProQuest: Data Processing and Visualization
- TD Ameritrade: Introducing the Science of Science (Sci2) Tool, Machine Learning Algorithms
- Fundação de Apoio á Universidade Federal de São Paulo, Brazil: Analysis and Visualization of SciELO Data