Data & Workflows
This page provides links to datasets, software, and high resolution figures associated with CNS publications.
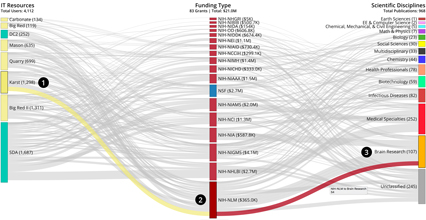
XDMoD Value Analytics: Visualizing the Impact of Internal IT Investments on External Funding, Publications, and Collaboration Networks
Scrivner O, Singh G, Bouchard SE, Hutcheson SC, Fulton B, Link MR and Börner K (2018) XD Metrics on Demand Value Analytics: Visualizing the Impact of Internal Information Technology Investments on External Funding, Publications, and Collaboration Networks. Front. Res. Metr. Anal. 2:10. doi: 10.3389/frma.2017.00010
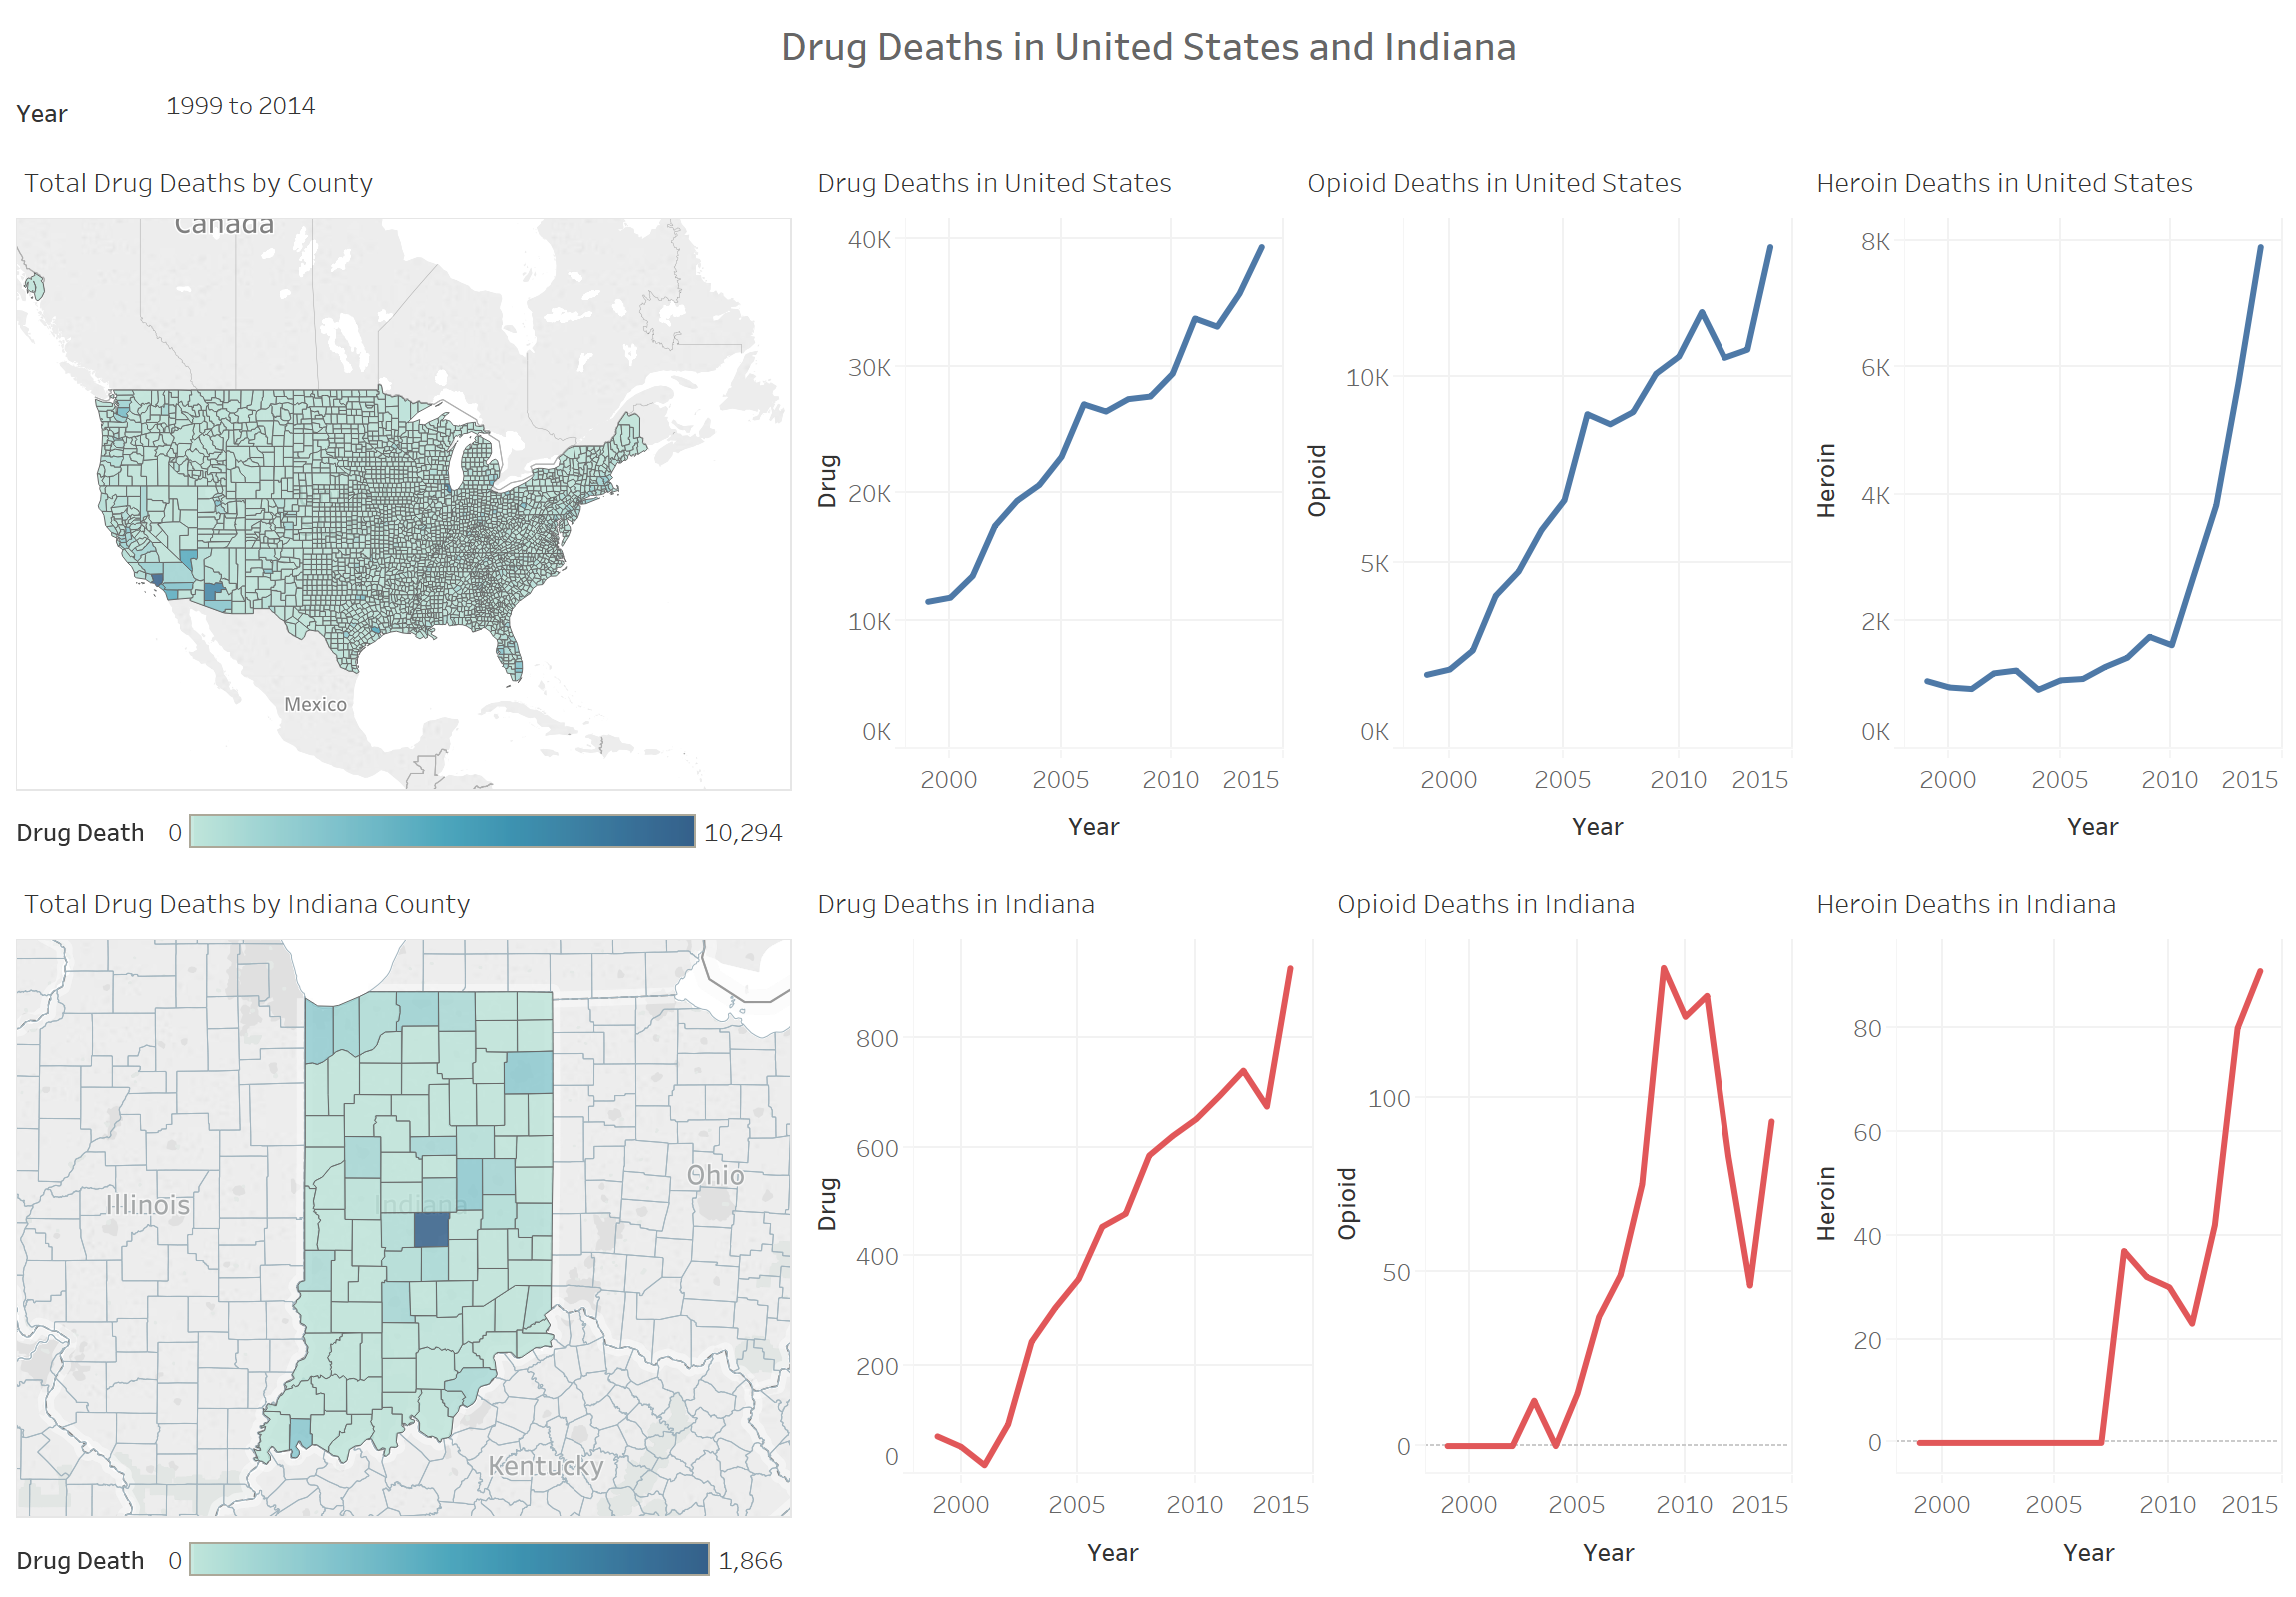
Reproducible Visual Analytics of Public Opioid Data
Jivitesh Poojary, Olga Scrivner, and Katy Börner present Reproducible Visual Analytics of Public Opioid Data, at Indy Big Data Visualization Challenge Indianapolis, IN.
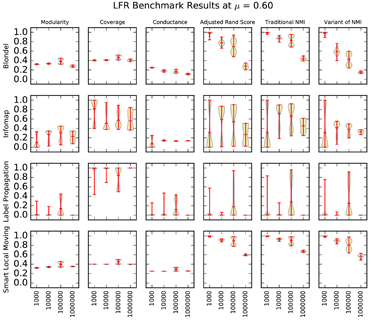
Analysis of Network Clustering Algorithms and Cluster Quality Metrics at Scale
Emmons S, Kobourov S, Gallant M, Börner K (2016) Analysis of Network Clustering Algorithms and Cluster Quality Metrics at Scale. PLoS ONE 11(7): e0159161. doi:10.1371/journal.pone.0159161
MOOC Visual Analytics
Scott R. Emmons, Robert P. Light, and Katy Börner (submitted) MOOC Visual Analytics: Empowering Students, Teachers, Researchers, and Platform Developers of Massively Open Online Courses.
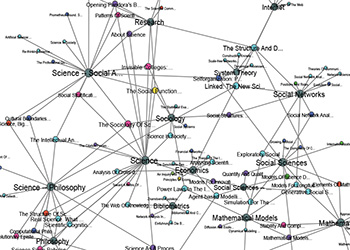
Modelling the Structure and Dynamics of Science Using Books
Ginda, Michael, Andrea Scharnhorst, and Katy Börner. 2016. "Modelling Science". In Theories of Informetrics: A Festschrift in Honor of Blaise Cronin, edited by Sugimoto, Cassidy, 304-334. Munich: De Gruyter Saur.
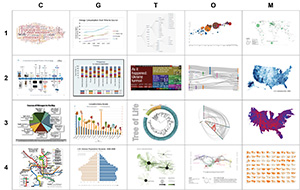
Data Visualization Literacy: Can 273 Science Museum Visitors Read 20 Information Visualizations?
Börner, Katy, Russell Balliet, and Adam V. Maltese. 2015. "Investigating Aspects of Data Visualization Literacy Using 20 Information Visualizations and 273 Science Museum Visitors". Information Visualization 1-16.
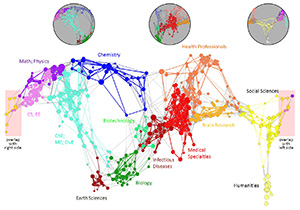
Design and Update of a Classification System: The UCSD Map of Science
Börner, Katy, Richard Klavans, Michael Patek, Angela Zoss, Joseph R. Biberstine, Robert Light, Vincent Larivière, and Kevin W. Boyack (2012) Design and Update of a Classification System: The UCSD Map of Science. PLoS ONE 7(7): e39464. doi:10.1371/journal.pone.0039464
Analysis and Visualization of the IV 2004 Contest Dataset
Ke, Weimao, Katy Börner, and Lalitha Viswanath. 2004. Major Information Visualization Authors, Papers and Topics in the ACM Library. IEEE Information Visualization Conference, Houston, Texas, Oct 10-12, 2004.
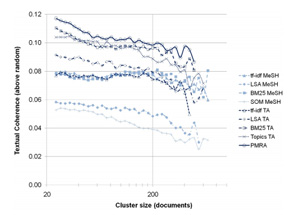
Clustering More Than Two Million Biomedical Publications: Comparing the Accuracies of Nine Text-Based Similarity Approaches
Boyack, Kevin W., David Newman, Russell Jackson Duhon, Richard Klavans, Michael Patek, Joseph R. Biberstine, Bob Schijvenaars, André Skupin, Nianli Ma, and Katy Börner. 2011. "Clustering More Than Two Million Biomedical Publications: Comparing the Accuracies of Nine Text-Based Similarity Approaches". PLoS ONE 6(3): 1-11.