Reproducible Visual Analytics of Public Opioid Data
Abstract:
According to the Report on the Toll of Opioid Use in Indiana and Marion County (2016), the state of Indiana has a more than 500% increase in deaths from drug poisonings and drug overdoses. In fact, the number of drug related deaths has surpassed the number of death caused by motor vehicle accidents. To turn raw data into actionable knowledge for state leaders and decision makers, the Indy Big Data Conference organized a visualization challenge to track Indiana’s highest areas of opioid abuse and to identify up to 10 contributing factors to the abuse using the data sets provided and any additional data sets the sponsor companies/organizations decide to include. This site links to data and code used in the slides
- Jivitesh Poojary, Olga Scrivner, and Katy Börner present Reproducible Visual Analytics of Public Opioid Data, at Indy Big Data Visualization Challenge Indianapolis, IN.
presented on September 14, 2017.
Team:
High-Resolution Figures:
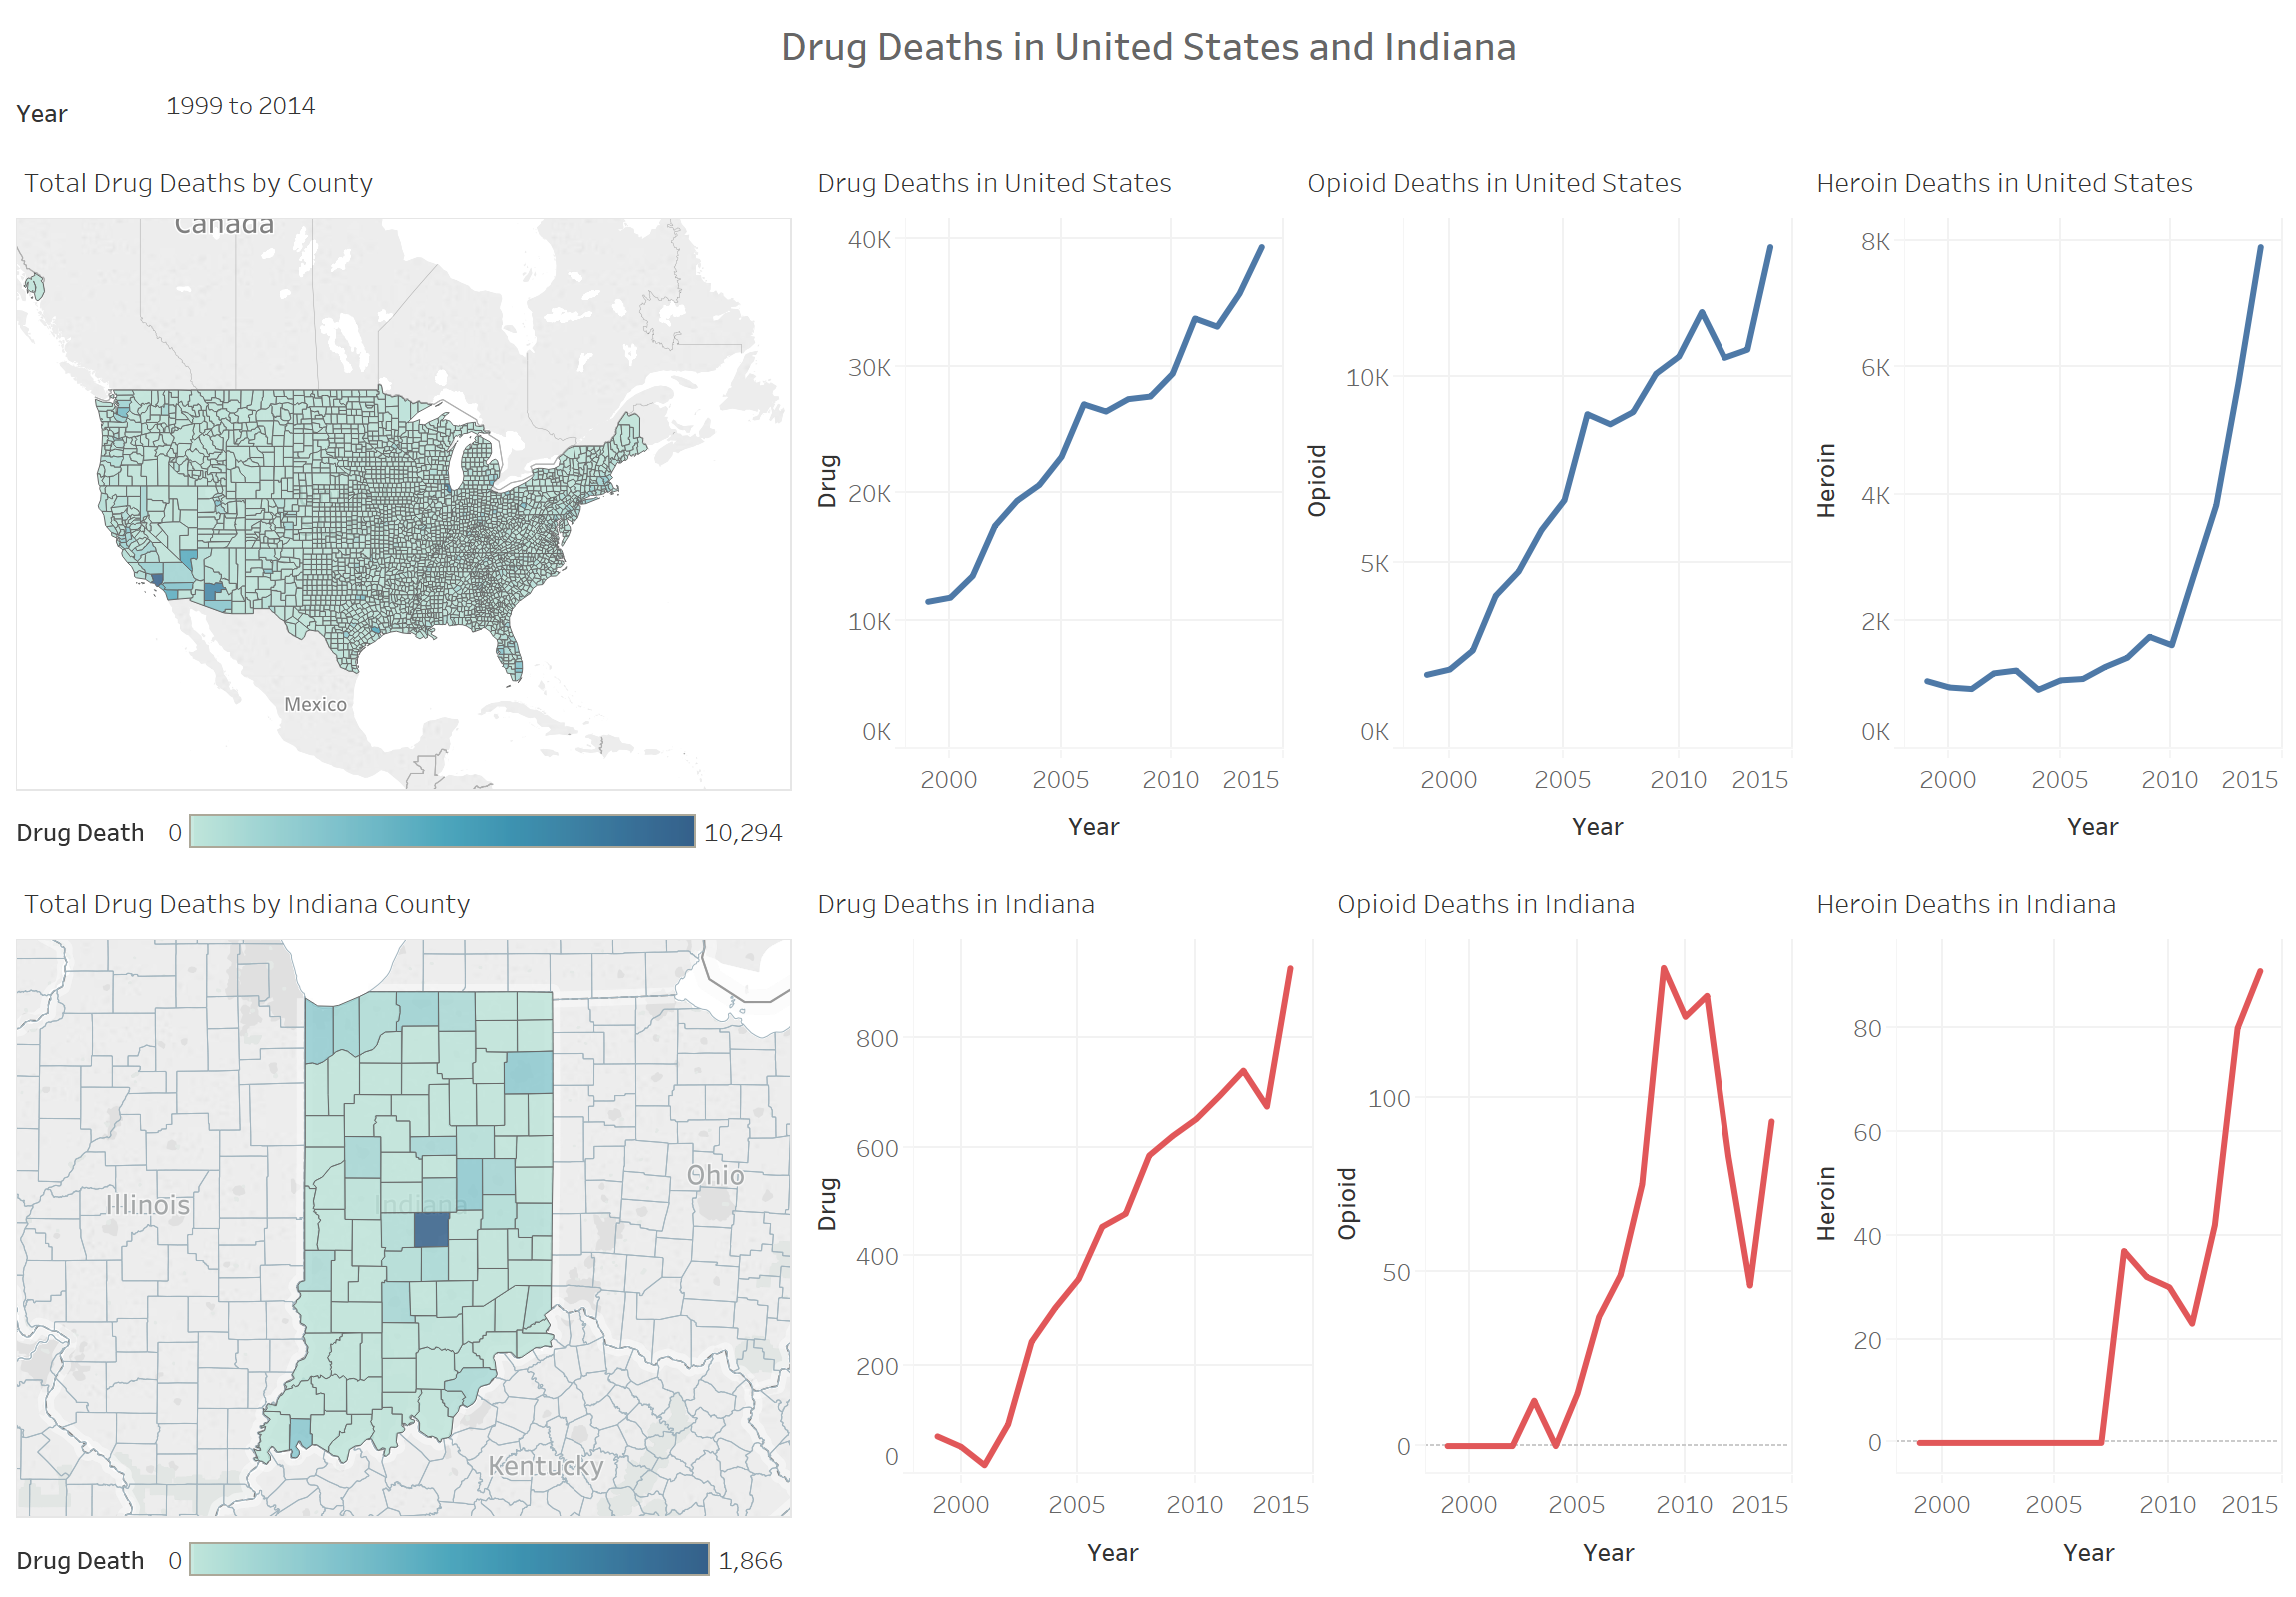 Figure 1: Drug Deaths in United States and Indiana: As time progresses, the number of states as well as Indiana counties with higher cases of drug abuse become more prevalent. |
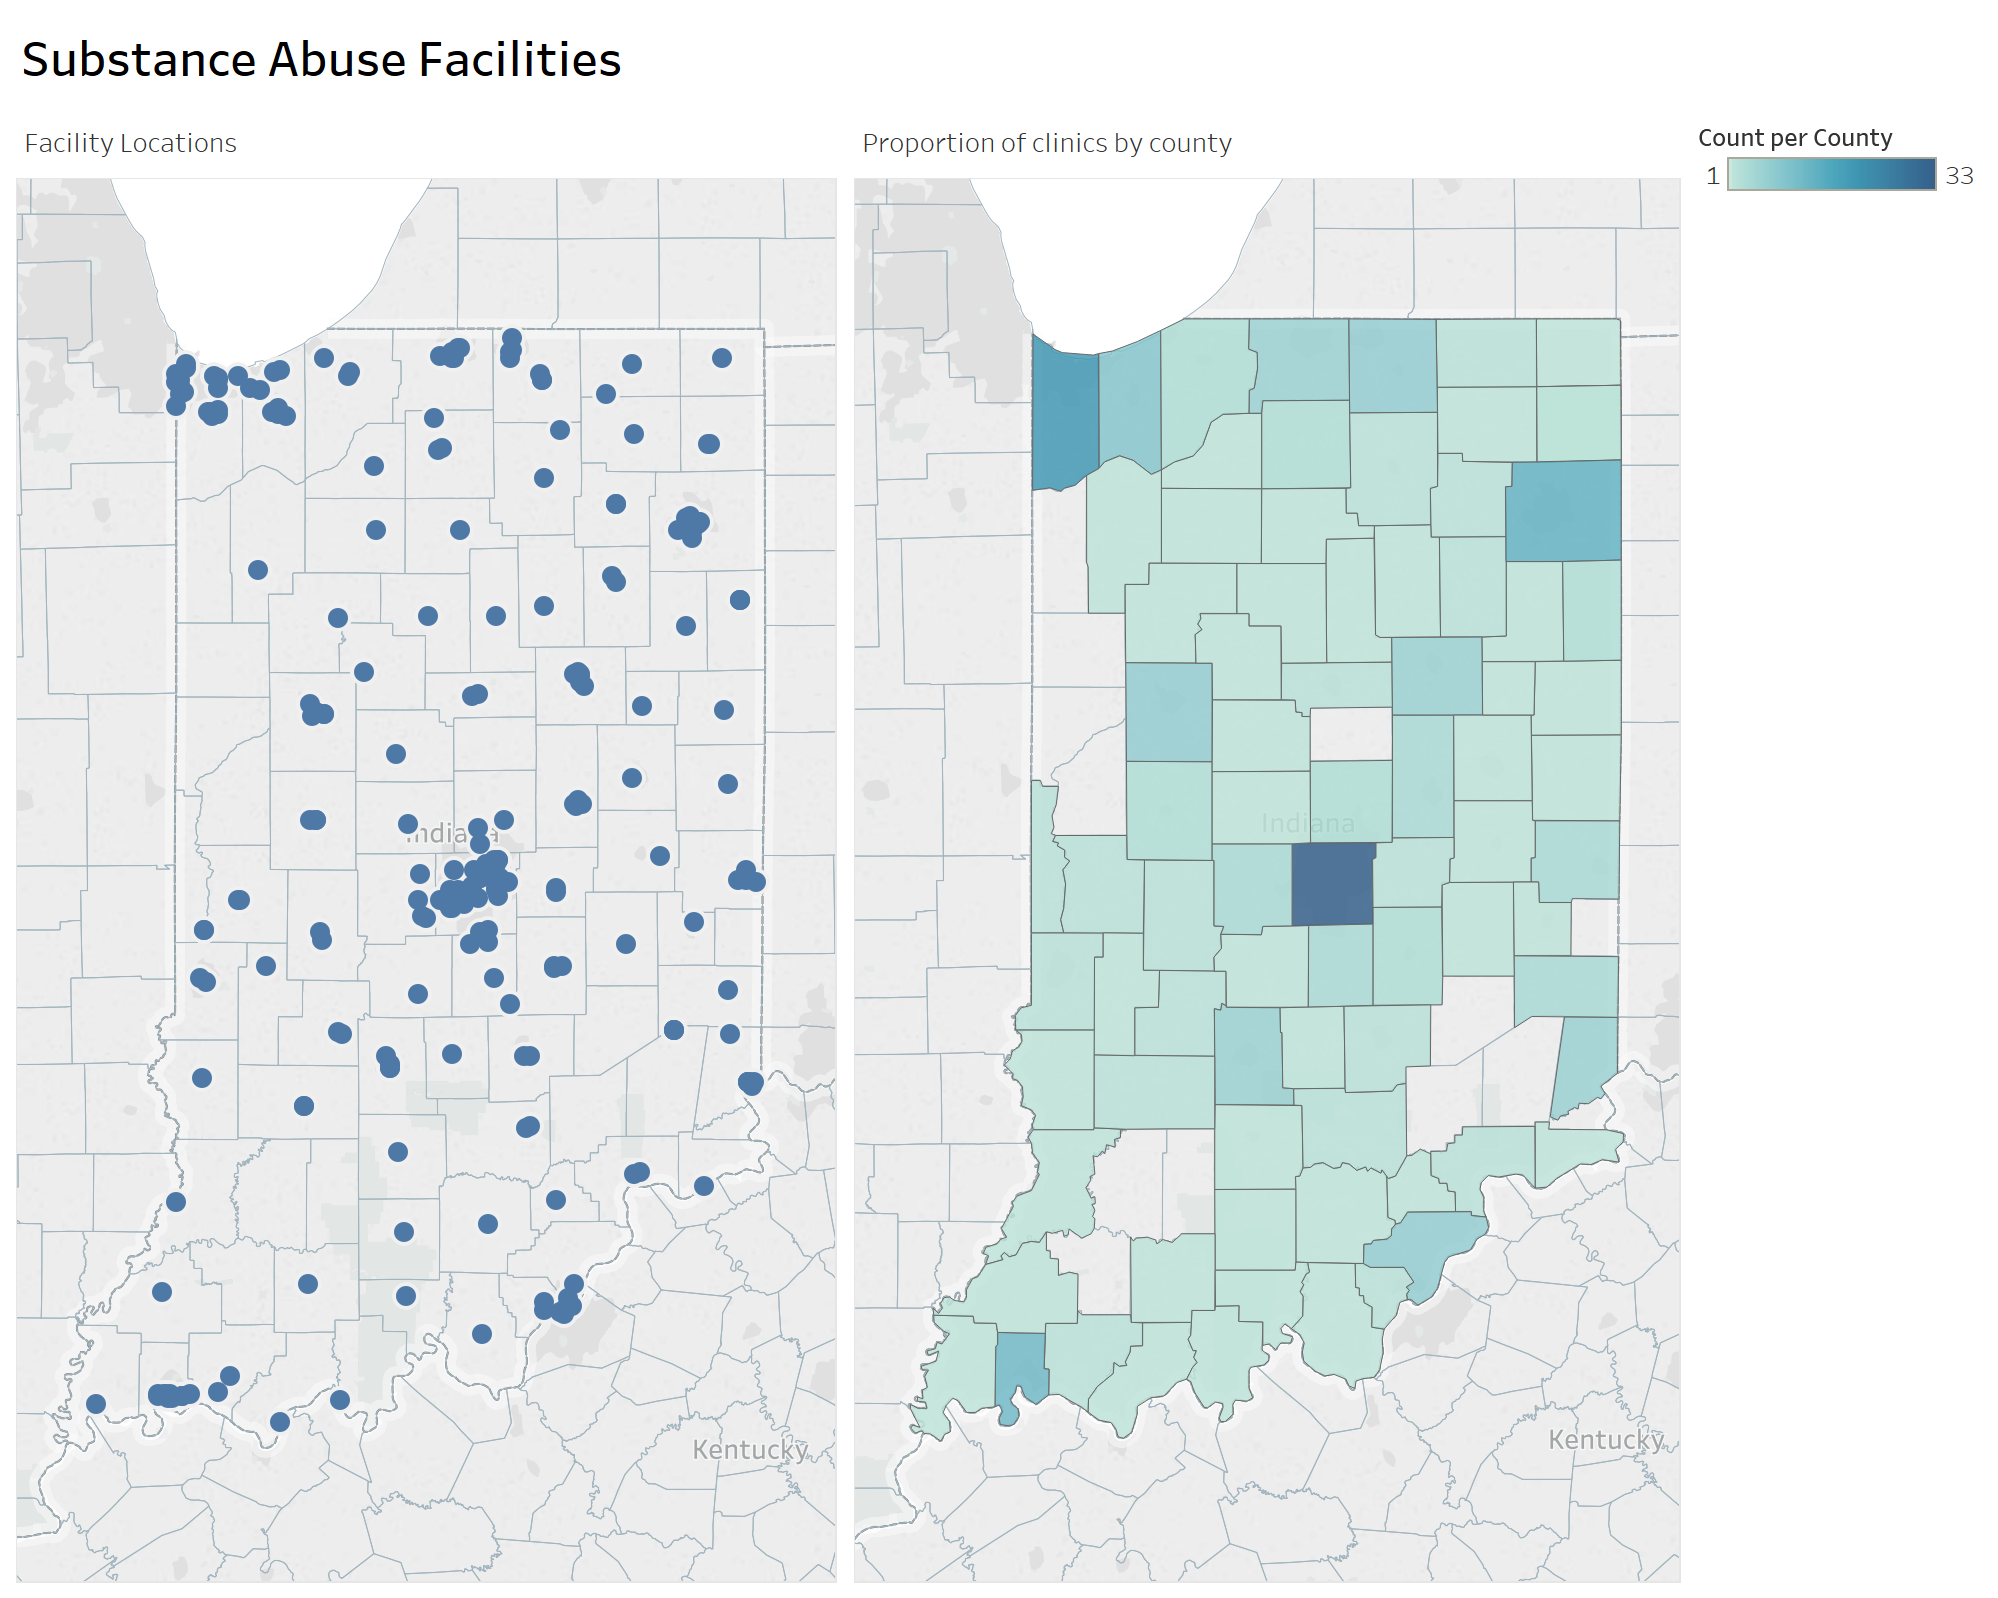 Figure 2: Substance Abuse Facilities: These facilities provide opioid dependent patients with a range of services, including withdrawal management, (detoxification), counseling, and the use of FDA-approved addiction pharmacotherapies (Report, 2016, p.69). |
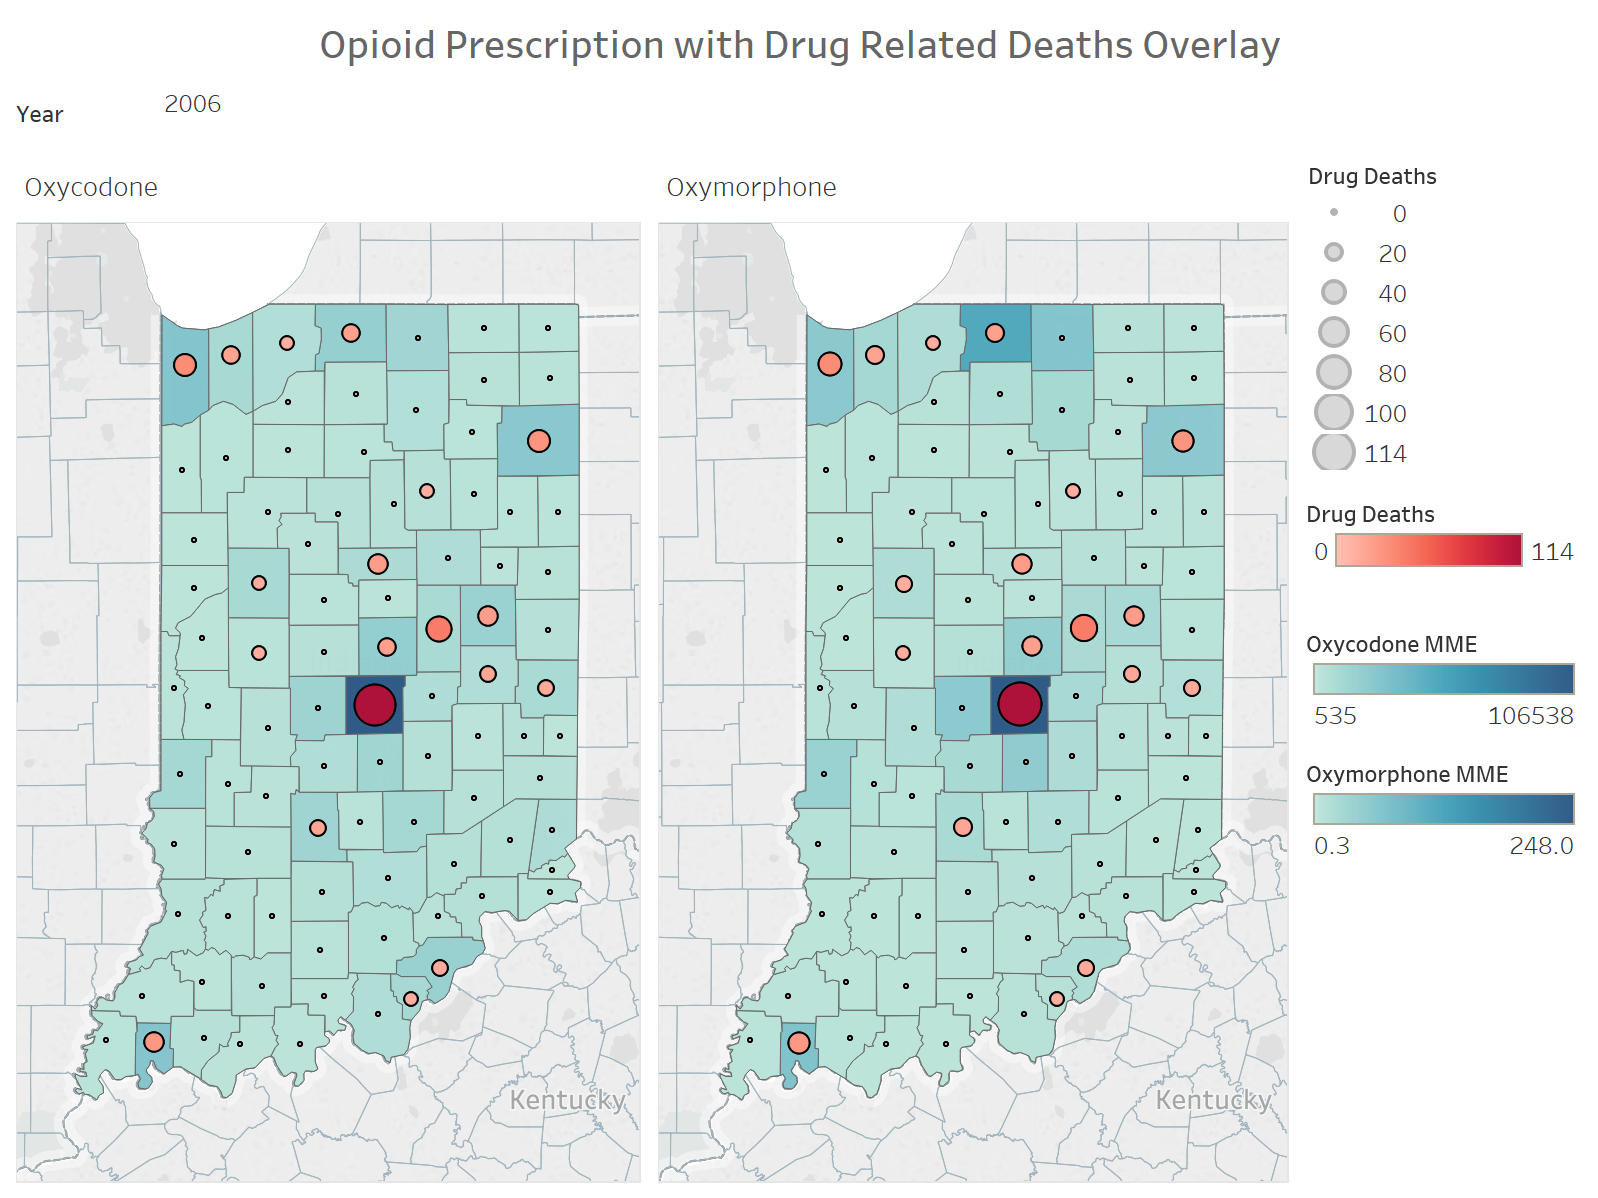 Figure 3: Opioid Prescription with Drug Related Deaths Overlay. Higher prescription rates seem to correlate with higher numbers of drug deaths. |