Exhibits: Places and Spaces
| Kerry Britt | George A. Smathers Libraries: Library News
The following is an article from the George A. Smathers Library News. Download a PDF of the original article here.
Marston Science Library
Second floor
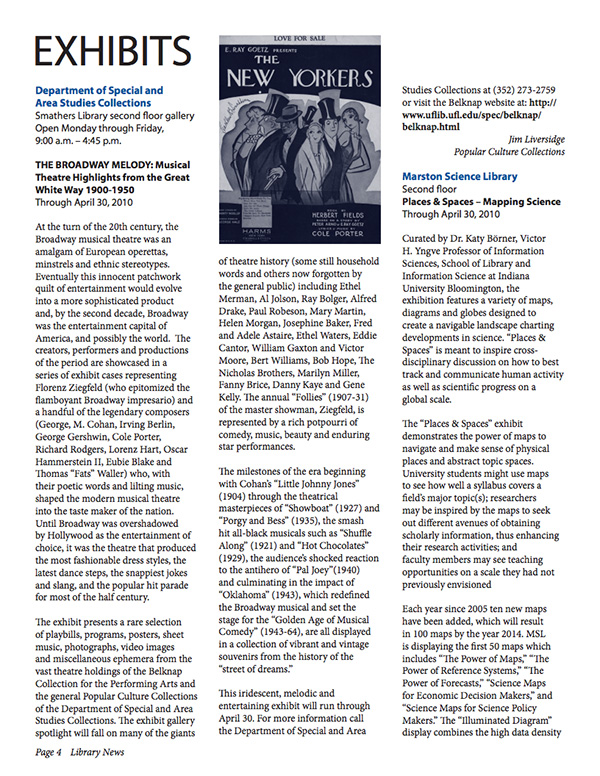
Places & Spaces – Mapping Science
Through April 30, 2010
Curated by Dr. Katy Börner, Victor
H. Yngve Professor of Information
Sciences, School of Library and
Information Science at Indiana
University Bloomington, the
exhibition features a variety of maps,
diagrams and globes designed to
create a navigable landscape charting
developments in science. “Places &
Spaces” is meant to inspire crossdisciplinary
discussion on how to best
track and communicate human activity
as well as scientific progress on a
global scale.
The “Places & Spaces” exhibit
demonstrates the power of maps to
navigate and make sense of physical
places and abstract topic spaces.
University students might use maps
to see how well a syllabus covers a
field’s major topic(s); researchers
may be inspired by the maps to seek
out different avenues of obtaining
scholarly information, thus enhancing
their research activities; and
faculty members may see teaching
opportunities on a scale they had not
previously envisioned.
Each year since 2005 ten new maps
have been added, which will result
in 100 maps by the year 2014. MSL
is displaying the first 50 maps which
includes “The Power of Maps,” “The
Power of Reference Systems,” “The
Power of Forecasts,” “Science Maps
for Economic Decision Makers,” and
“Science Maps for Science Policy
Makers.” The “Illuminated Diagram”
display combines the high data density
of two large prints – a map of the
world and a map of science – with the
flexibility of an interactive program
driving a touch panel display and
two projectors that illuminate the
maps. Touching a science area on
the lectern’s touch screen leads to an
illumination of the origin of all papers
on the selected scientific topic in the
geographic map.
The World processor globes bring
dimensionality to three diverse
views of scientific inquiry and global
diffusion. Foreign U.S. patent holders
are represented in a relationship scaled
by productivity; worldwide patent
grants are plotted on a global scale
through history, and geomorphic
representations of areas of exceptional
innovation and productivity; finally,
science itself is shaped into sculptural
form that is generated from the
proximity of scientific fields of research
to each other.
A reception serving light refreshments
will be held at MSL on Thursday,
March 18 from 3:15 to 6:00 p.m.
During the reception “The Story of
Science Maps” will be presented by
Börner. Also featured are Dr. Robert
Hatch, UF associate professor of
history, and Jason Harrington from the
UF graduate school of mathematics.
“Places & Spaces” exhibitions have
also been held at Stanford University,
University of Alberta, Institute for
Research Information and Quality
Assurance in Bonn, Germany, National
Science Foundation in Washington,
D.C., Storm Hall, San Diego State
University and WDG Architecture,
Washington, D.C.
The online counterpart at http://
scimaps.org provides links to
a selected series of maps and
their makers along with detailed
explanations of why these maps work.