Workshops
Data Visualization Literacy: Assessing and Improving Visitors’ Abilities to Read and Make Data Visualizations
Date
September 25, 2016
Meeting Place
ASTC Annual Conference, Museum of Science and Industry
Tampa, Florida
Session Leader
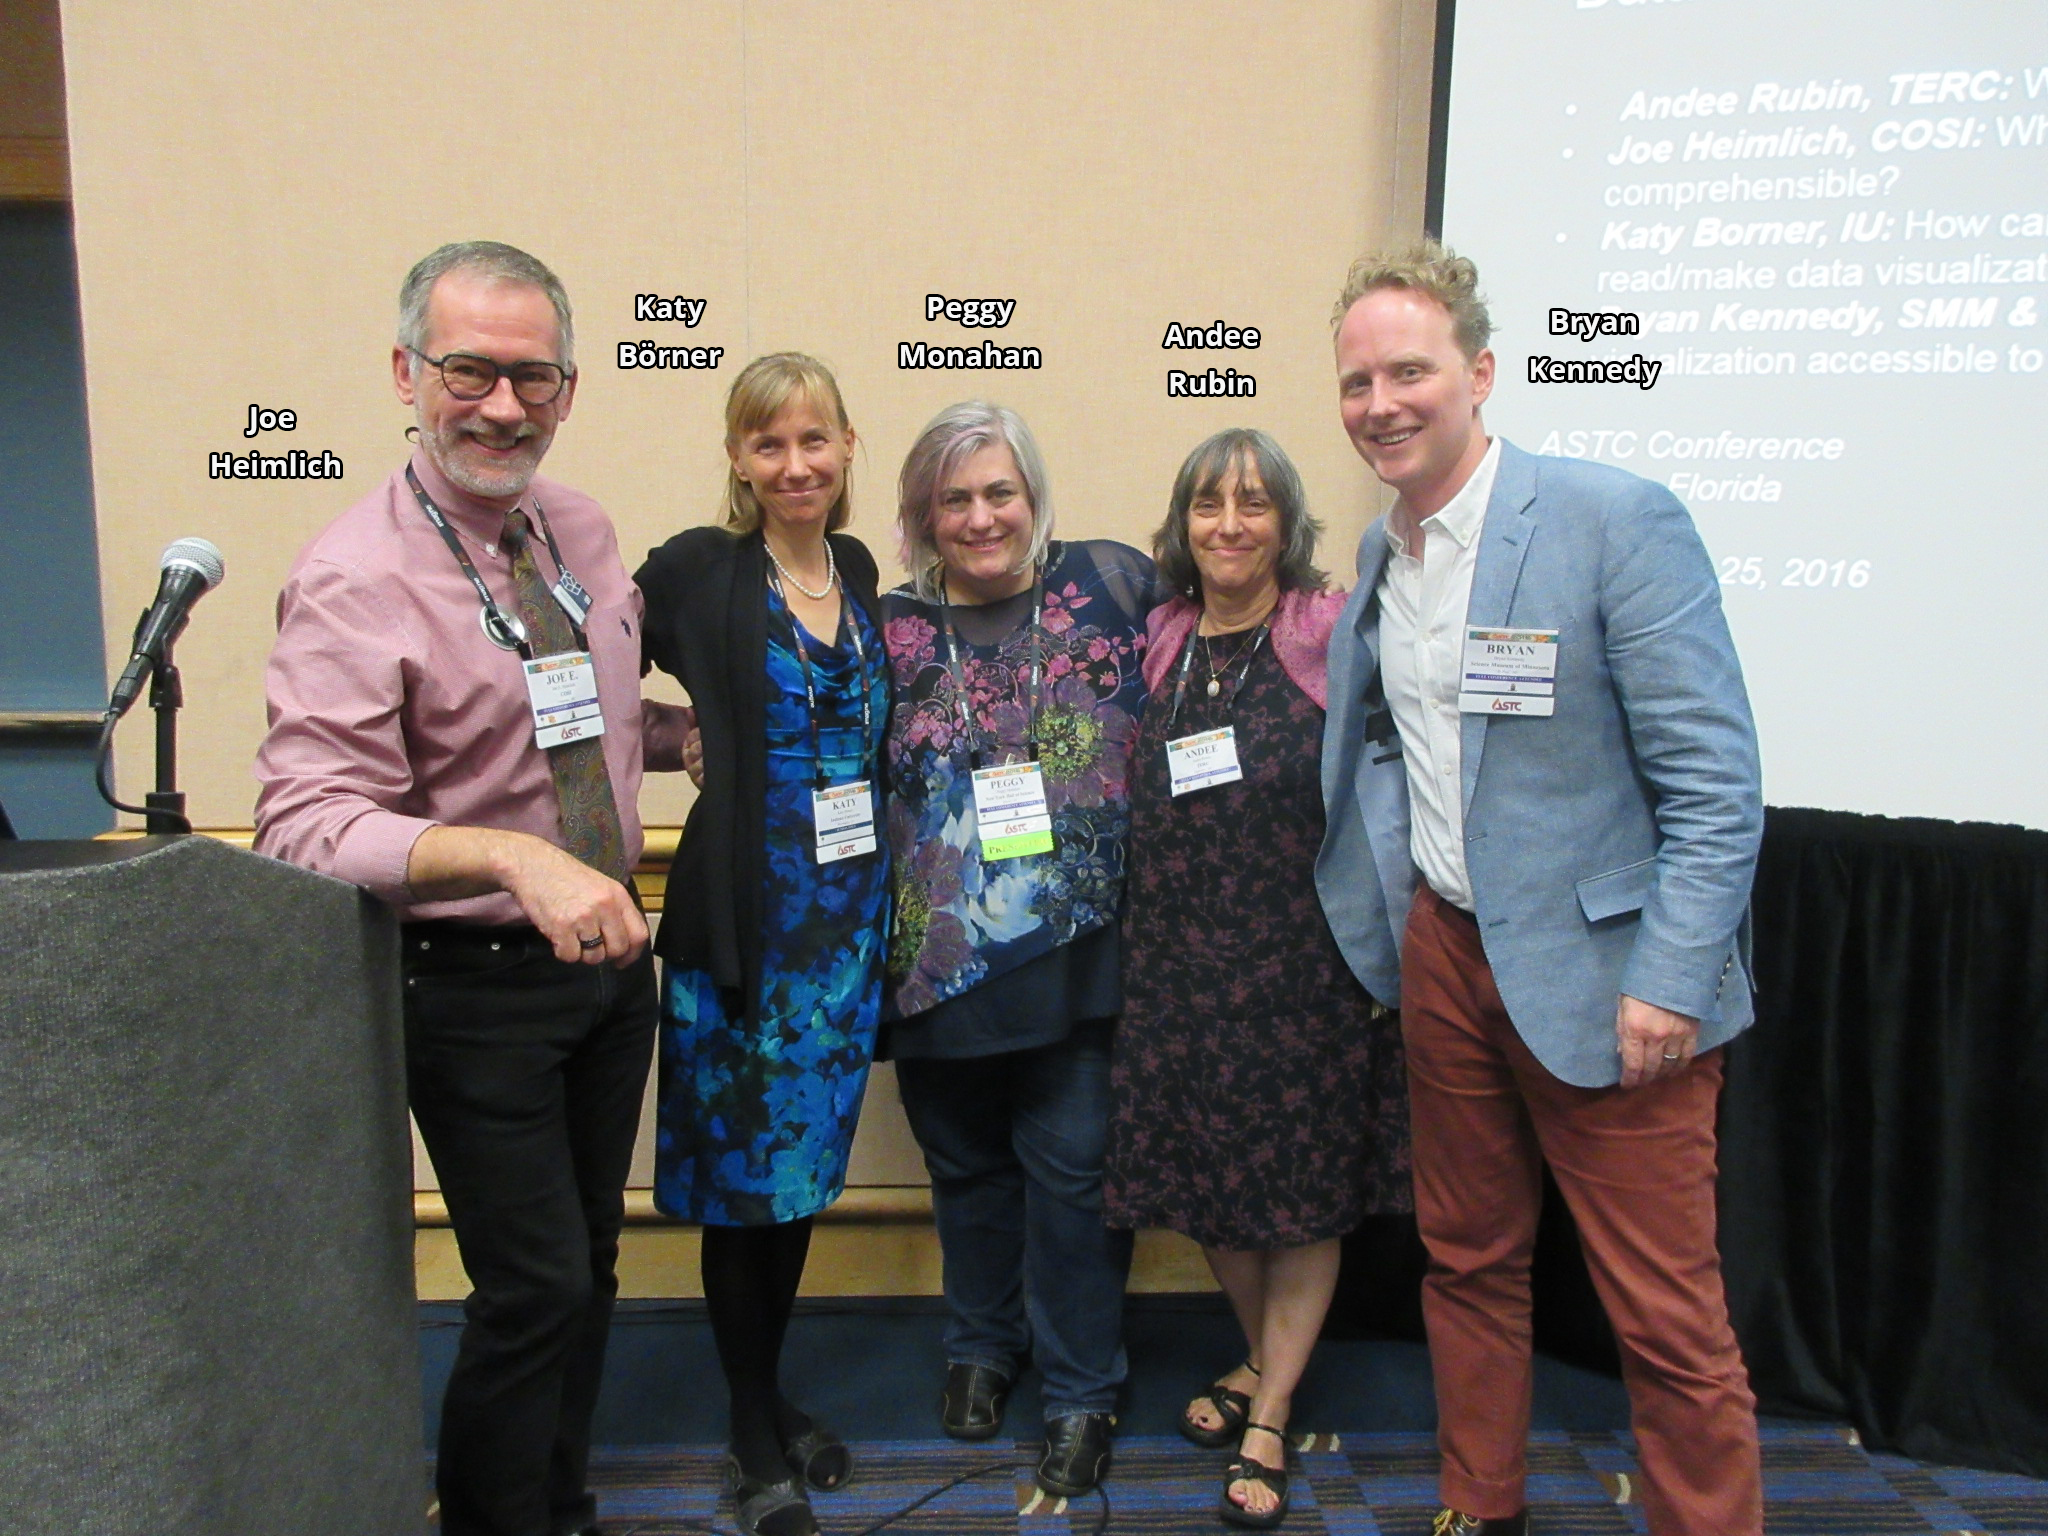
Katy Börner (Indiana University, USA)
Summary
In the information age, being able to “read and write” data visualizations is becoming as important as being able to read and write text. This session features presentations and demonstrations by researchers and practitioners that develop approaches and tools which assess, exploit, and improve data visualization literacy of their users.
Session Presenters
Katy Börner, Victor H. Yngve Distinguished Professor of Information Science
Indiana University
Andee Rubin, Senior Scientist
TERC
Cambridge, MA
Slides
Joe Heimlich, COSI Senior Researcher
COSI
Columbus, OH
Slides
Bryan Kennedy, Director, Exhibit Media Design and Development
Science Museum of Minnesota
Minneapolis, MN
Slides
Peggy Monahan, Creative Director of Exhibit Development
New York Hall of Science
Slides
Description
Drawing on prior work in psychology, cartography, statistics, information visualization, and other fields, this session will feature
Introductions of theoretically grounded and practically useful visualization design frameworks that aim to empower the broadest spectrum of users, such as policymakers, educators, and information users from many disciplines to create and interpret visual representations of data that are useful and meaningful to them.
Demonstrations of novel approaches to assess data visualization literacy, such as the free online app that is used to support and examine skill acquisition in the Information Visualization MOOC (http://ivmooc.cns.iu.edu);
Demonstrations of so called “Plug-and-Play Macroscopes”—modular hardware and software platforms that render data into insights, first prototypes were discussed in a panel at ASTC2015; and
Presentations of evaluation results from visitors interacting with data visualizations, e.g., lessons learned from adding Macroscopes to the international Places & Spaces: Mapping Science exhibit (http://scimaps.org/call).
Results from museum floor studies shows that all ages of the general public are missing critical data visualization literacy skills. Science and technology centers are perfectly positioned to fill this need for knowledge and skills, given their work with mixed age groups and their reputation as a reliable source of up-to-date science and technology information.
References
A file with relevant references can be downloaded here.