Workshops
Informal Meeting on Mapping Science
Date:
December 1-2, 2005
Meeting Place:
Thomson Scientific
Garfield room (3rd floor)
3501 Market Street
Philadelphia, PA
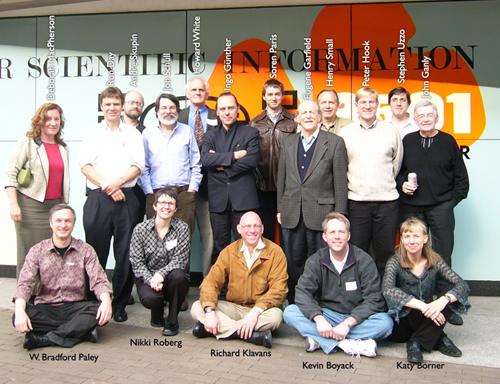
Photos:
Organizers:

Katy Börner
Victor H. Yngve Professor of Information
Science, Department of Information and Library
Science, School of Informatics and Computing,
Indiana University, Bloomington; Director,
Cyberinfrastructure for Network Science Center
& Curator of Mapping Science exhibit,
Bloomington, IN
ude.anaidni@ytak
PR^2 | Slides

Deborah MacPherson
Accuracy & Aesthetics, Washington, DC.
Project director for Accuracy & Aesthetics that
aims to visualize context
driven topologies. Co-curator of Places & Spaces.
PR^2
Workshop Goals & Agenda:
This 1.5 day, invitation-only workshop will bring together programmers and power users of major visual analytics/science of science tools. Key goals of the workshop are- improved integration/collaboration between existing tools/developers,
- the preparation of an international competition that inspires and empowers many to contribute algorithm and tool plugins, and
- discussion of joint funding applications.
Format is a combination brief presentations, brainstorming sessions, and hands-on sessions--to be finalized when participants are confirmed.
Participants, please fill out this PR^2 and send to Samantha Hale (ude.anaidni@elahjs) by October 18!
Please see here about setting up the Development Environment.
Schedule:
Thursday, December 1, 2005
| 1:00-3:00pm | Introduction of
Attendees Please prepare a 10 minute overview of your work Major projects, funding, events |
| 3:00-3:30pm | Break |
| 3:30-5:30pm |
Discussion
|
| 5:30pm | Joint Dinner |
Friday, December 2, 2005
| 9:00-10:30am | Brainstorming session Discuss the next nine iterations for the Places and Spaces exhibit |
| 10:30-11:00am | Break |
| 11:00am-12:00pm | Brainstorming Session Discuss and select potential venues Discuss funding options |
| 12:00-1:00pm | Joint Lunch |
| 1:00-3:00pm | Discussion of Next Steps |
Participants Attending:

Kevin Boyack
Sandia National Laboratories
Science analyst and science map
maker. Power user of Sandia's VxInsight®
knowledge visualization tool.
PR^2 | PPT

Chaomei Chen
Associate Professor in the College of
Information Science and Technology, Drexel
University
Author of Information Visualization,
Mapping Scientific Frontiers, and
Information Visualisation and Virtual
Environments. Co-editor of Visualizing the
Semantic Web, Visual Interfaces to Digital
Libraries and Visualizing Information
Using SVG and X3D.
Developer of
CiteSpace.
PR^2 | PPT

Ron Day
Visiting Assistant Professor of Library and
Information Science, SLIS, Indiana University
Expert in the history, culture and political
economy of information, documentation,
communication, knowledge, and digital media,
particularly in the 20th and into the 21st
centuries.
PR^2

John Ganly
Assistant Director for Collections, Science, Industry and Business Library, New York Public Library & Adjunct Professor, SLIS, Rutgers University

Eugene Garfield
Founder & Chairman Emeritus Institute for
Scientific Information (now Thomson Scientific)
Pioneered bibliometrics and scientometrics research
and practice. Created the first Histogram in
1964. Developer of the HistCite
bibiliographic analysis and visualization
software.

Ingo Günther
NYC Artist & Designer
Designer of Worldprocessor.

Peter Hook
Ph.D. Student at SLIS, Indiana University
Works on
educational knowledge domain
visualizations.
PR^2 | PPT

Richard Klavans
Map of Science
Science analyst and science map
maker. Designer of tools for research
planning.

W. Bradford Paley
Digital Image Design Incorporated, Adjunct
Associate Professor, Department of Computer
Science, Columbia University, and Director of
Information
Esthetics
Designer of
CodeProfiles, TextArc, and TraceEncounters.
PR^2

Nikki Roberg
Master Student at SLIS, Indiana University
Works on
maps of science for kids.
PR^2 | PPT

Jon Schull
Rochester Insitute of Technology
Wrote Macroscope
Manifesto.
PR^2

Andre Skupin
San Diego State University
Cartographer and science map
maker.
PR^2 | PPT


Stephen Uzzo
Director of Technology, New York Hall of
Science
Collaborated on the design of
Connections - The Nature of Networks.
Interested in "How do we best educate people
as to the scope of science disciplines. ... [the
public] in general, has a poor grasp of what the
definition is of science itself ... they only know
something is science because we tell them it
is."
PR^2

Howard White
Professor Emeritus, College of Information
Science and Technology, Drexel University
Pioneered Scientometrics and Informetrics.Science
map makerand co-designer of AuthorMap.
Interested to educate K12 about bibliometrics &
scientometrics approaches and tools.
Background Information
MotivationThis meeting will bring together librarians, cartographers and geographers, computer and information scientists, bibliometricians and scientometricians, artists and designers, educators and others with a deep interest in improving access to mankind's scholarly knowledge and expertise. Many invitees are advisory board members of the Places and Spaces science exhibit. Since April 2005, the exhibit has been displayed at 18 national and international venues attracting a lot of attention and educating people about alternative means - besides Google and other search engines - to access and make sense of what we collectively know. It has also led to the fact that some of us have many more projects and requests for maps of science than they can possibly handle. Meeting Goals
This meeting has two goals: (I) It brings together science mapping researchers, designers and educators in an attempt to pool existing tools and resources so that a larger number of well funded requests for easily to understand maps of science can be satisfied. (II) We would like to discuss the next nine iterations of Places and Spaces in an attempt to develop a cohesive outline and plan the next nine years of computational scientometrics research to further bridge the gap between scholarly science mapping efforts and the needs of the general public to benefit and be able to learn from the steadily increasing flood of scholarly data. We plan to realize one iteration per year and envision the followng themes:
- First iteration compares and contrasts first maps of our entire planet with the first maps of all of science as we know it.
- The next iteration will compare and contrast existing reference systems (e.g., geographic, astronomic reference systems but also the table of elements used in chemistry, metabolic pathway maps, etc.) with potential reference systems for all of sciences.
- The third iteration will invite cartographers, designers and artists to render one of two base maps of all of science. The best ten maps will be selected for display.
- Multi-lingual maps of science versus the use of images, icons, symbols, visualizations, and research results
- Maps of science in presented and accessed layers from public schools to advanced research laboratories.
- Interactive maps of science, input and output methods, and tools for comparing, contrasting, and authenticating data.
- Daily science 'weather forecasts' in TV and online.
Travel/Housing:
Please contact Samantha Hale (ude.anaidni@elahjs) for travel arrangement.
Directions:
See the contact page for the Cyberinfrastructure for Network Science Center, http://cns.iu.edu/contact.html or contact Samantha Hale (ude.anaidni@elahjs.)
Acknowledgements:
This effort is supported by the James S. McDonnell Foundation and the Cyberinfrastructure for Network Science Center at Indiana University.


