XDMoD Value Analytics: Visualizing the Impact of Internal IT Investments on External Funding, Publications, and Collaboration Networks
Olga Scrivner, Gagandeep Singh, Sara E Bouchard, Scott Hutcheson, Ben Fulton, Matthew R. Link, and Katy Börner. (In Press). XDMoD Value Analytics: Visualizing the Impact of Internal IT Investments on External Funding, Publications, and Collaboration Networks. Frontiers in Research Metrics and Analytics, Edited by: Kevin Boyack. DOI: 10.3389/frma.2017.00010
Abstract:
Many universities invest substantial resources in the design, deployment, and maintenance of campus-based cyberinfrastructure. To justify the expense, it is important that university administrators and others understand and communicate the value of these internal investments in terms of scholarly impact. This paper introduces two visualizations and their usage in the Value Analytics (VA) module for Open XD Metrics on Demand (XDMoD), which enable analysis of external grant funding income, scholarly publications, and collaboration networks. The VA module was developed by Indiana University’s (IU) Research Technologies division, Pervasive Technology Institute, and the Cyberinfrastructure for Network Science Center (CNS), in conjunction with the University at Buffalo’s Center for Computational Research (CCR). It provides diverse visualizations of measures of information technology (IT) usage, external funding, and publications in support of IT strategic decision making. This paper details the data, analysis workflows, and visual mappings used in two VA visualizations that aim to communicate the value of different IT usage in terms of NSF and NIH funding, resulting publications, and associated research collaborations. To illustrate the feasibility of measuring IT values on research, we measured its financial and academic impact from the period between 2012 and 2017 for IU. The financial return on investment (ROI) is measured in terms of IU funding, totaling $339,013,365 for 885 NIH and NSF projects associated with IT usage, and the academic ROI constitutes 968 publications associated with 83 of these NSF and NIH awards. In addition, the results show that Medical Specialties, Brain Research, and Infectious Diseases are the top three scientific disciplines ranked by the number of publications during the given time period.
Team:
Olga Scrivner1, Gagandeep Singh1, Sara E Bouchard1, Scott Hutcheson1, Ben Fulton2, Matthew R. Link2, Katy Börner1
1 Department of Intelligent Systems Engineering, School of Informatics, Computing and Engineering, Indiana University, Bloomington, Indiana, USA
2 Pervasive Technology Institute, Indiana University, Bloomington, Indiana, USA
High-Resolution Figures:
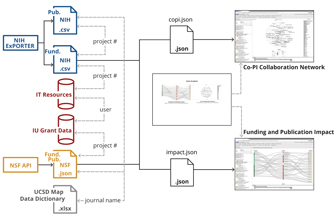 Figure 1: Data sources, data linkage, data preparation for XDMoD VA visualizations |
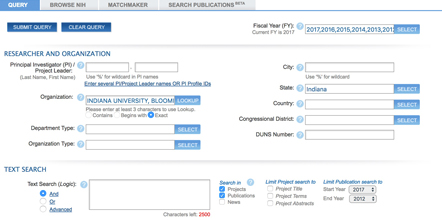 Figure 2: NIH RePORTER online search query |
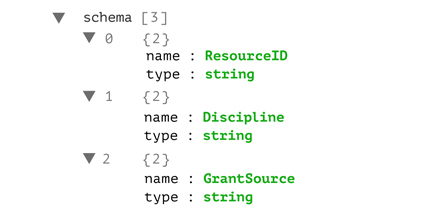 Figure 3: JSON data schema for the Funding and Publication Impact visualization plugin |
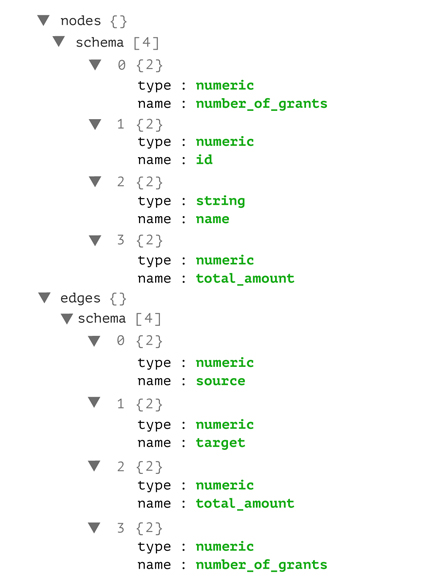 Figure 4: JSON data schema for the Co-PI Collaboration Network visualization plugin |
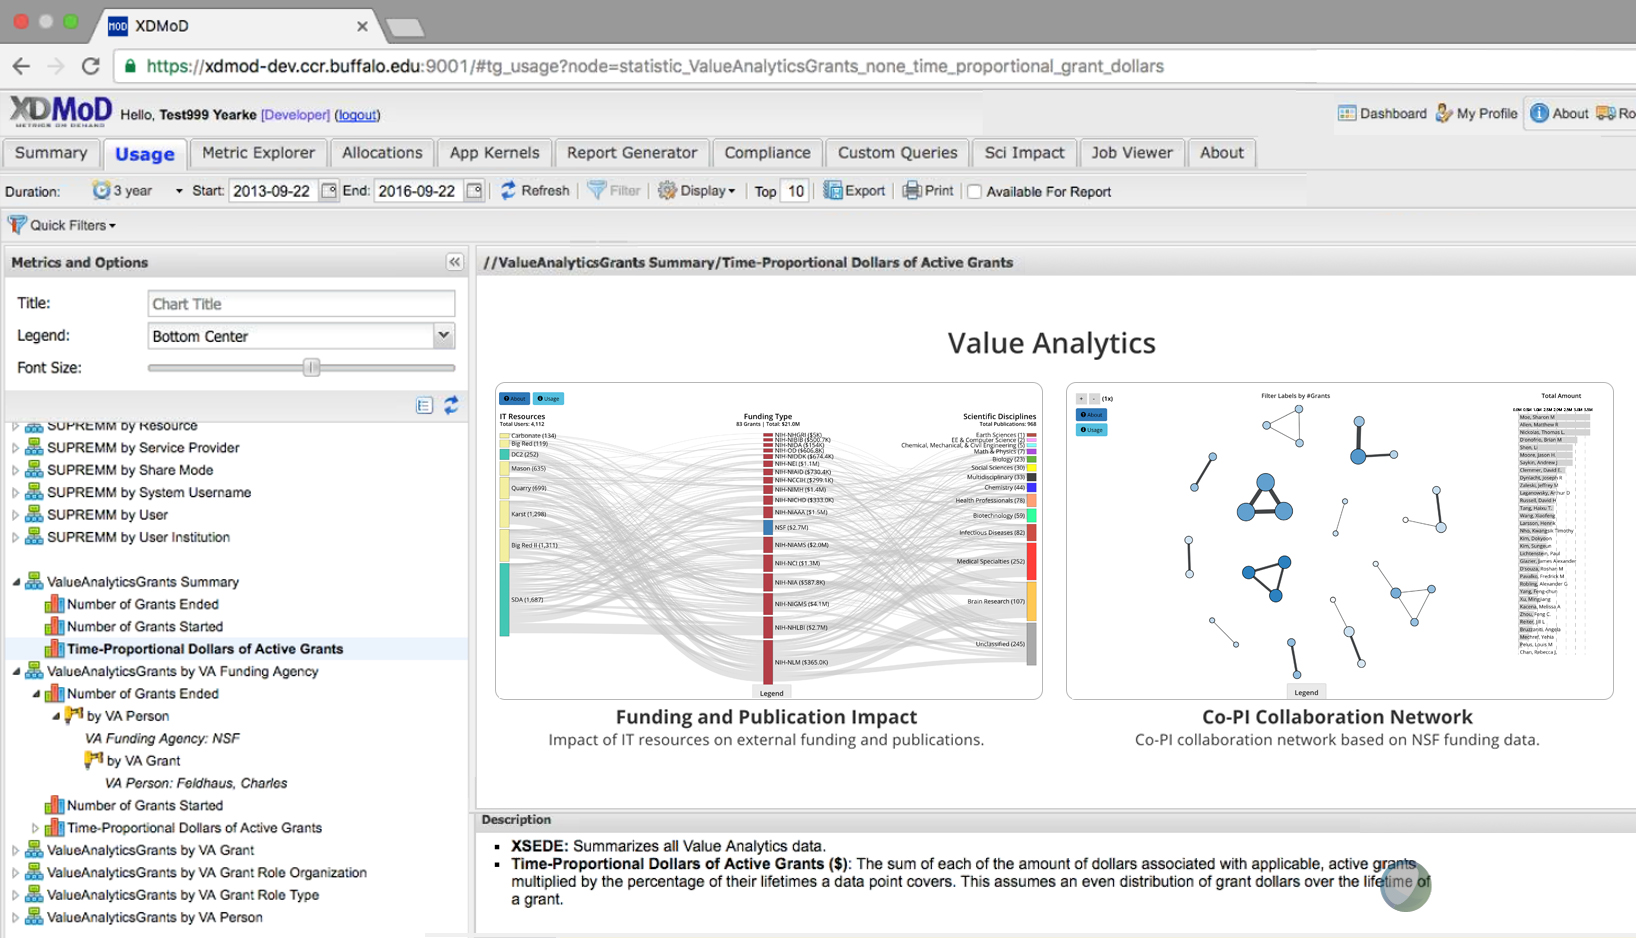 Figure 5: XDMoD VA Portal, see interactive version at http://demo.cns.iu.edu/xdmod-p/portal.html |
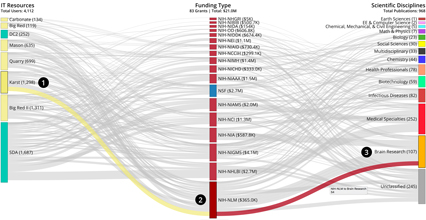 Figure 6: XDMoD VA Funding and Publication Impact Visualization, see interactive version at http://demo.cns.iu.edu/xdmod-p/impact.html.
|
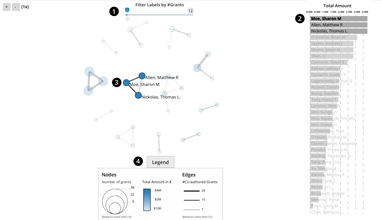 Figure 7: XDMoD VA Co-PI Network Visualization, see interactive version at http://demo.cns.iu.edu/xdmod-p/co-pi.html.
|