Workshops
JSMF Workshop on Science Maps in Education
Date:
November 17-18, 2011
Meeting Place:
School of Library and Information Science, Indiana University
1320 E. 10th St., Wells Library, Room: LI 170D
Bloomington, IN 47405
Indiana University Campus Map »
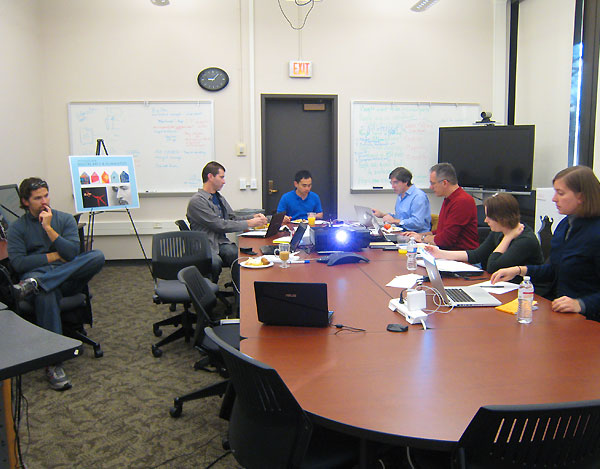
Photos:

Organizers:
Katy Börner
Victor H. Yngve Professor of Information Science, School of Library and Information Science, Indiana University, Bloomington;
Director, Cyberinfrastructure for Network Science Center; Curator, Places & Spaces: Mapping Science exhibit, katy@iu.edu
PR^2 | VIVO | Slides
Workshop Goals & Agenda:
The workshop brings together leading experts in the design, prototyping, and evaluation of travelling science exhibit with science map makers to elaborate the recent "Full-Scale Development: Anyone Can Map: Charting and Exploring the History and Future of Science and Technology" preproposal for resubmission as an 2-year $250,000 ISE Pathway project. Detailed learning objectives and associated exhibit activities, e.g.,
- 'turn on/off' different data streams and tell which one is most massive/overpowering
- take one data set and plot it as timeline, scatter plot, or overlaid on a geo and topic map. What different insights are gained?
- explore networks - start with a table, extract a network, analyze and visualize it (see slides 61-66 in http://ivl.cns.iu.edu/km/pres/2011-borner-sci2tutorial-nsf.pdf). Identify clusters and backbones so that they can be prototyped and tested with children to substantiate a follow-up full proposal.
We might like to identify preliminary studies that help demonstrate children's interest in mapping/seeing/understanding their (social) networks, envision possible career trajectories, experience battles for owning intellectual space via patents, etc. We could decide to ask 8-10 year olds to pick their top-n from the set of 20 possible learning objectives/exhibits. I truly believe my 9 and 12 year old daughters would love to climb data mountains, slide down and follow the trajectories of merging and diverging information flows (virtually?), puzzle together their own family network/the family/collaboration networks of famous scientists, or open/close 'data pipes' to see what data pours out of them into/onto different base maps (scatter, geo, topic maps).
Schedule:
Thursday, November 17, 2011
Room: LI 170D
| 12:00pm | Welcome by Organizers (Katy Börner ) |
| 1:00pm | General Introduction by Participants (10 min per person/organization) |
| 2:00pm | Break |
| 2:30pm | Overview Talks (15-20 mins plus 5 mins discussion each, present general works/consideration first followed by a concrete plan for what can be done in a 2-year $250,000 ISE Pathway project.)
|
| 4:30pm | Break |
| 5:00pm | Discussion of Opportunities and Challenges |
| 6:30pm |
Joint dinner |
Friday, November 18, 2011
| 9:00am | Breakfast |
| 9:30am | Breakout Session on "Learning objectives and possible Prototypes for exhibit experiences" [Session 1 | Session 2 | Session 3] |
| 11:00am | Break |
| 11:15am | Proposal Writing Time - Each team writes 1-3 pages as input to the Pathway proposal |
| 12:15pm | Joint Lunch |
| 12:30pm | Joint Working Lunch |
| 1:00pm | Breakout Session on "Preliminary studies and evaluation design" [Session 1 | Session 2 | Session 3] |
| 2:30pm | Break |
| 2:45pm | Timeline and Milestones. Budget. Also meet Sam and Charlotte who will help with proposal compilation. |
| 3:45pm | Adjourn |
Participants Attending:

Joe Harsh
PhD student, Indiana University

Joe Heimlich
Senior Science and Technology Policy Analyst, SRI International
PR^2 | Slides

Chin Hua Kong
Systems Architect/Project Manager, Cyberinfrastructure for Network Science Center

Adam Maltese
Assistant Professor of Science Education / Adjunct Faculty in Geological Sciences, Indiana University Bloomington
Slides

Paul Martin
Senior Vice President, Science Learning, Science Museum of Minnesota
Participating Remotely

Sasha Palmquist
Senior Research Associate, Institute for Learning Innovation

Michael J. Stamper
Senior Graphic Designer, Cyberinfrastructure for Network Science Center; Co-curator, Places & Spaces: Mapping Science exhibit
Slides

Stephen Uzzo
Vice President of Science and Technology, New York Hall of Science

Angela Zoss
Doctoral Student, School of Library and Information Science, Indiana University Bloomington
Travel/Housing:
Please contact Samantha Hale (sjhale@iu.edu) to arrange travel.
Directions:
See the contact page for the Cyberinfrastructure for Network Science Center, http://cns.iu.edu/contact.html or contact Samantha Hale (ude.anaidni@elahjs).
Acknowledgments:
This effort is supported by the James S. McDonnell Foundation and Cyberinfrastructure for Network Science Center at Indiana University.