CDC Museum to Host Places & Spaces: Mapping Science Exhibition
| CDC Newsroom
New CDC Museum Exhibit - Places & Spaces: Mapping Science
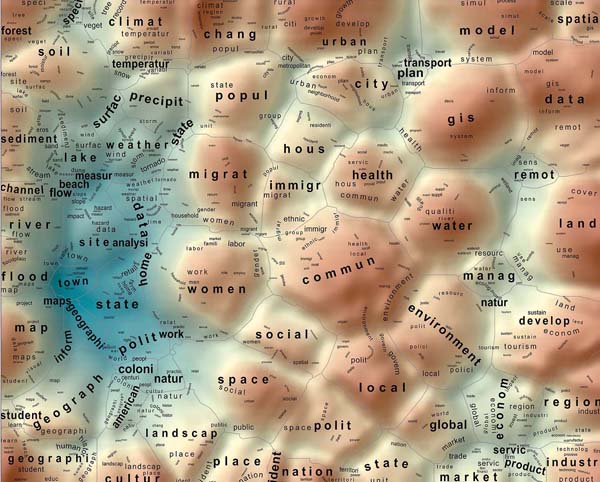
One of the many infographics found at the exhibit.
Read the original story at the Centers for Disease Control website
Data visualization is a powerful tool that helps both scientists and the public quickly understand the scope and context of complex health threats. From January 25 to June 17, 2016, the David J. Sencer CDC Museum will feature the Places & Spaces: Mapping Science exhibition showing how data visualization helps us confront some of the world’s most significant challenges.
Public health leaders need the best information to make better, faster decisions – and often need to communicate complicated health information that can save lives. Advances in maps, graphs, and other images can greatly help the public understand health threats and lead to quicker public health responses.
The Places & Spaces exhibition has collected science maps and visualization tools from leading international experts in the natural, physical, and social sciences, as well as from industry and government. By helping audiences grasp the abstract concepts, relationships, and dynamism of complex systems, the exhibition promotes more informed, effective decision making on the part of private individuals, industry practitioners, public policy makers, and others.
Read the full story on the Centers for Disease Control website.