Workshops
Plug-and-Play Macroscopes
Date:
November 3-4, 2014
Meeting Place:
Social Science Research Commons (SSRC), Indiana University
Woodburn Hall, Room 200
1100 East Seventh Street
Bloomington, IN 47405
Indiana University Campus Map »
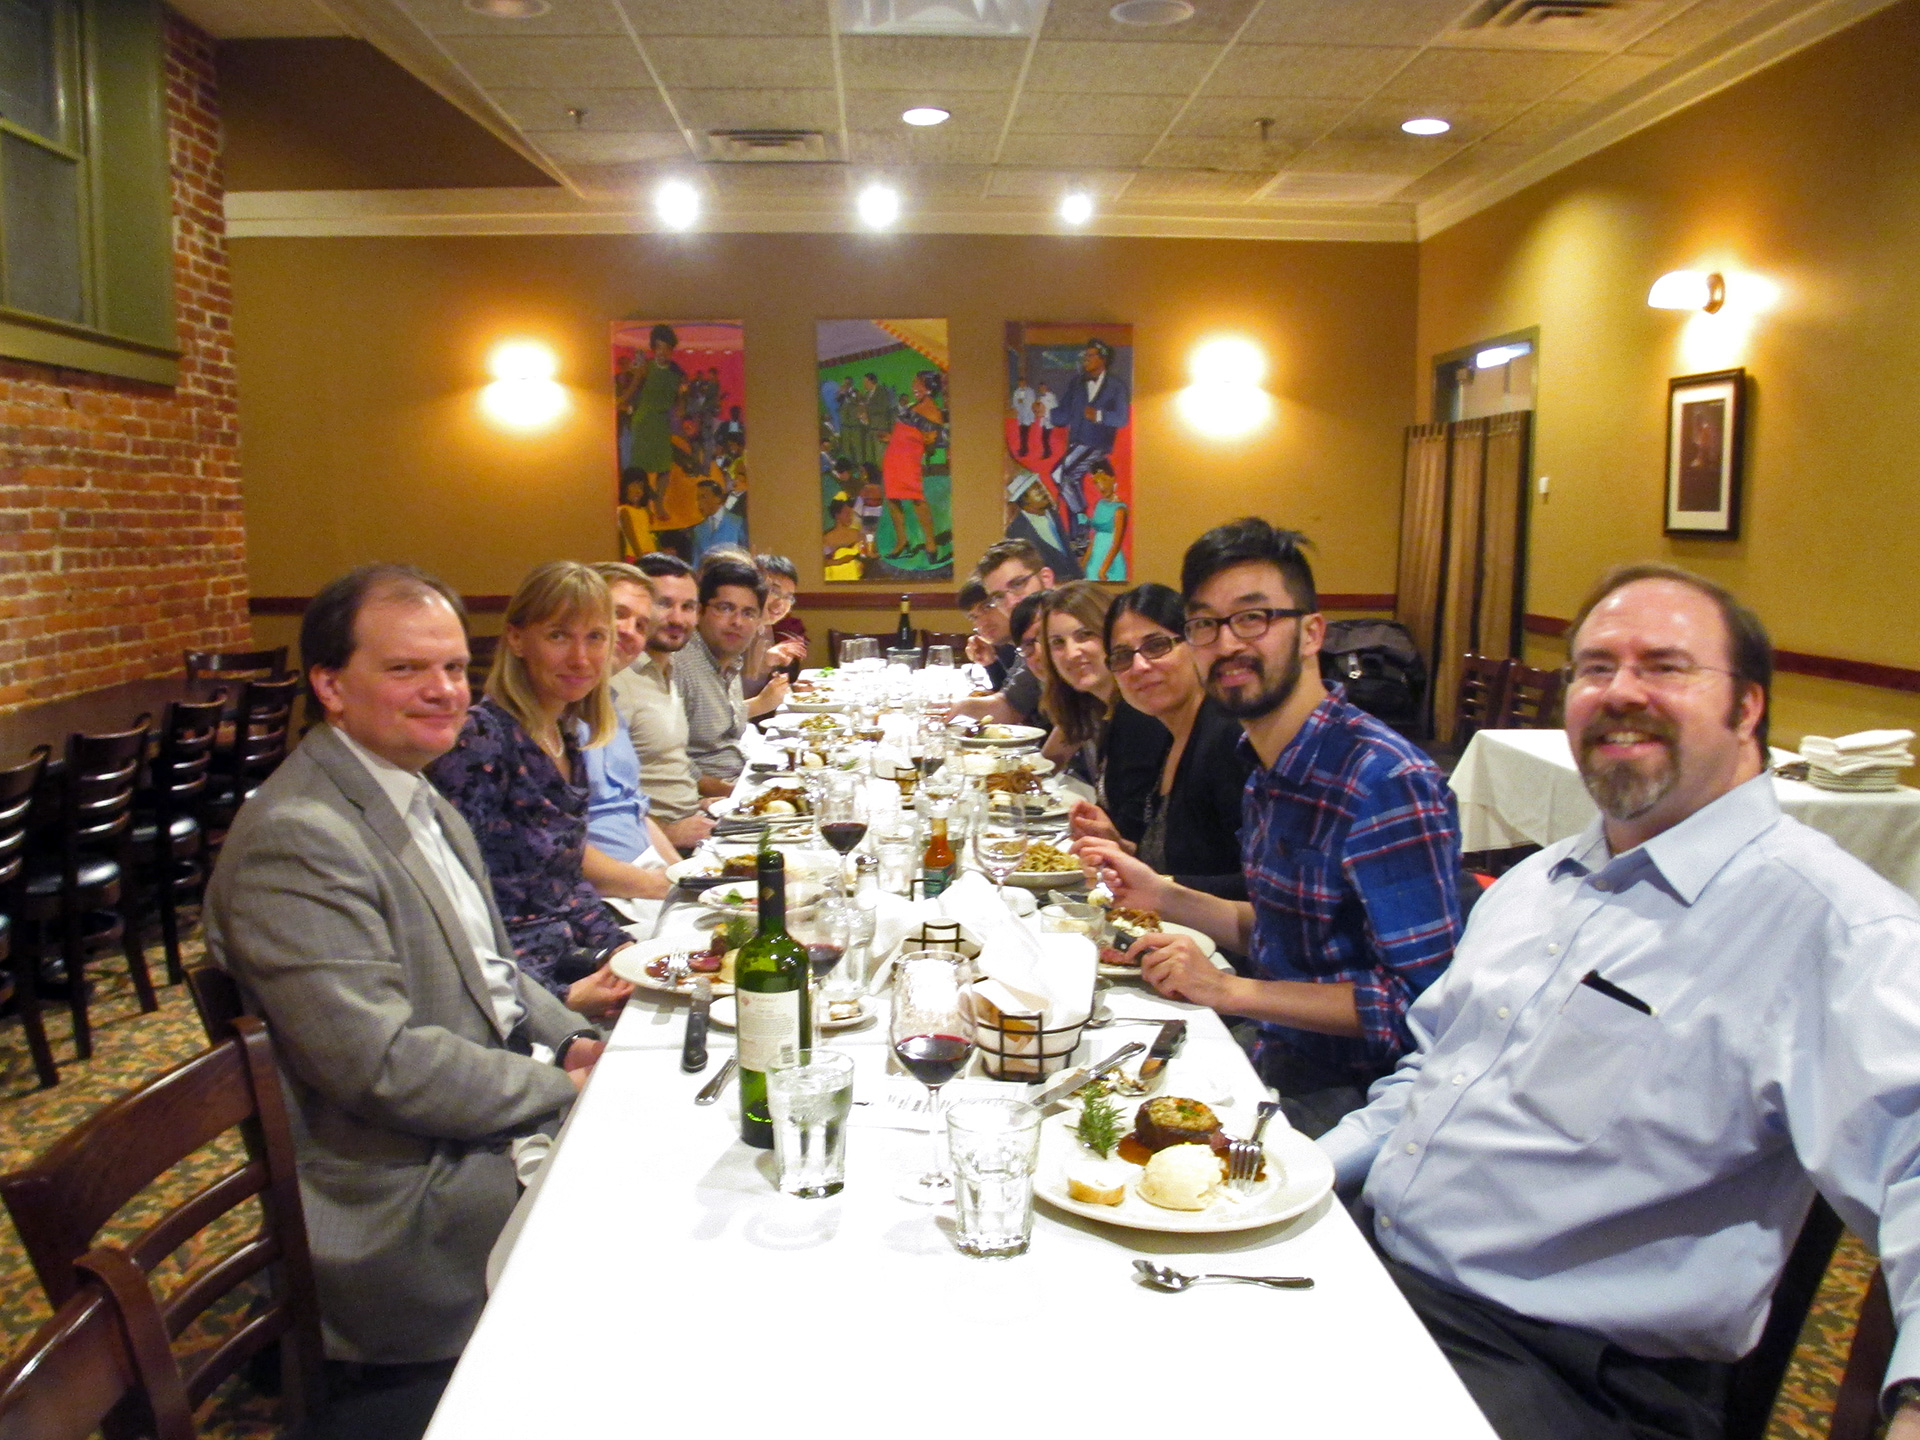
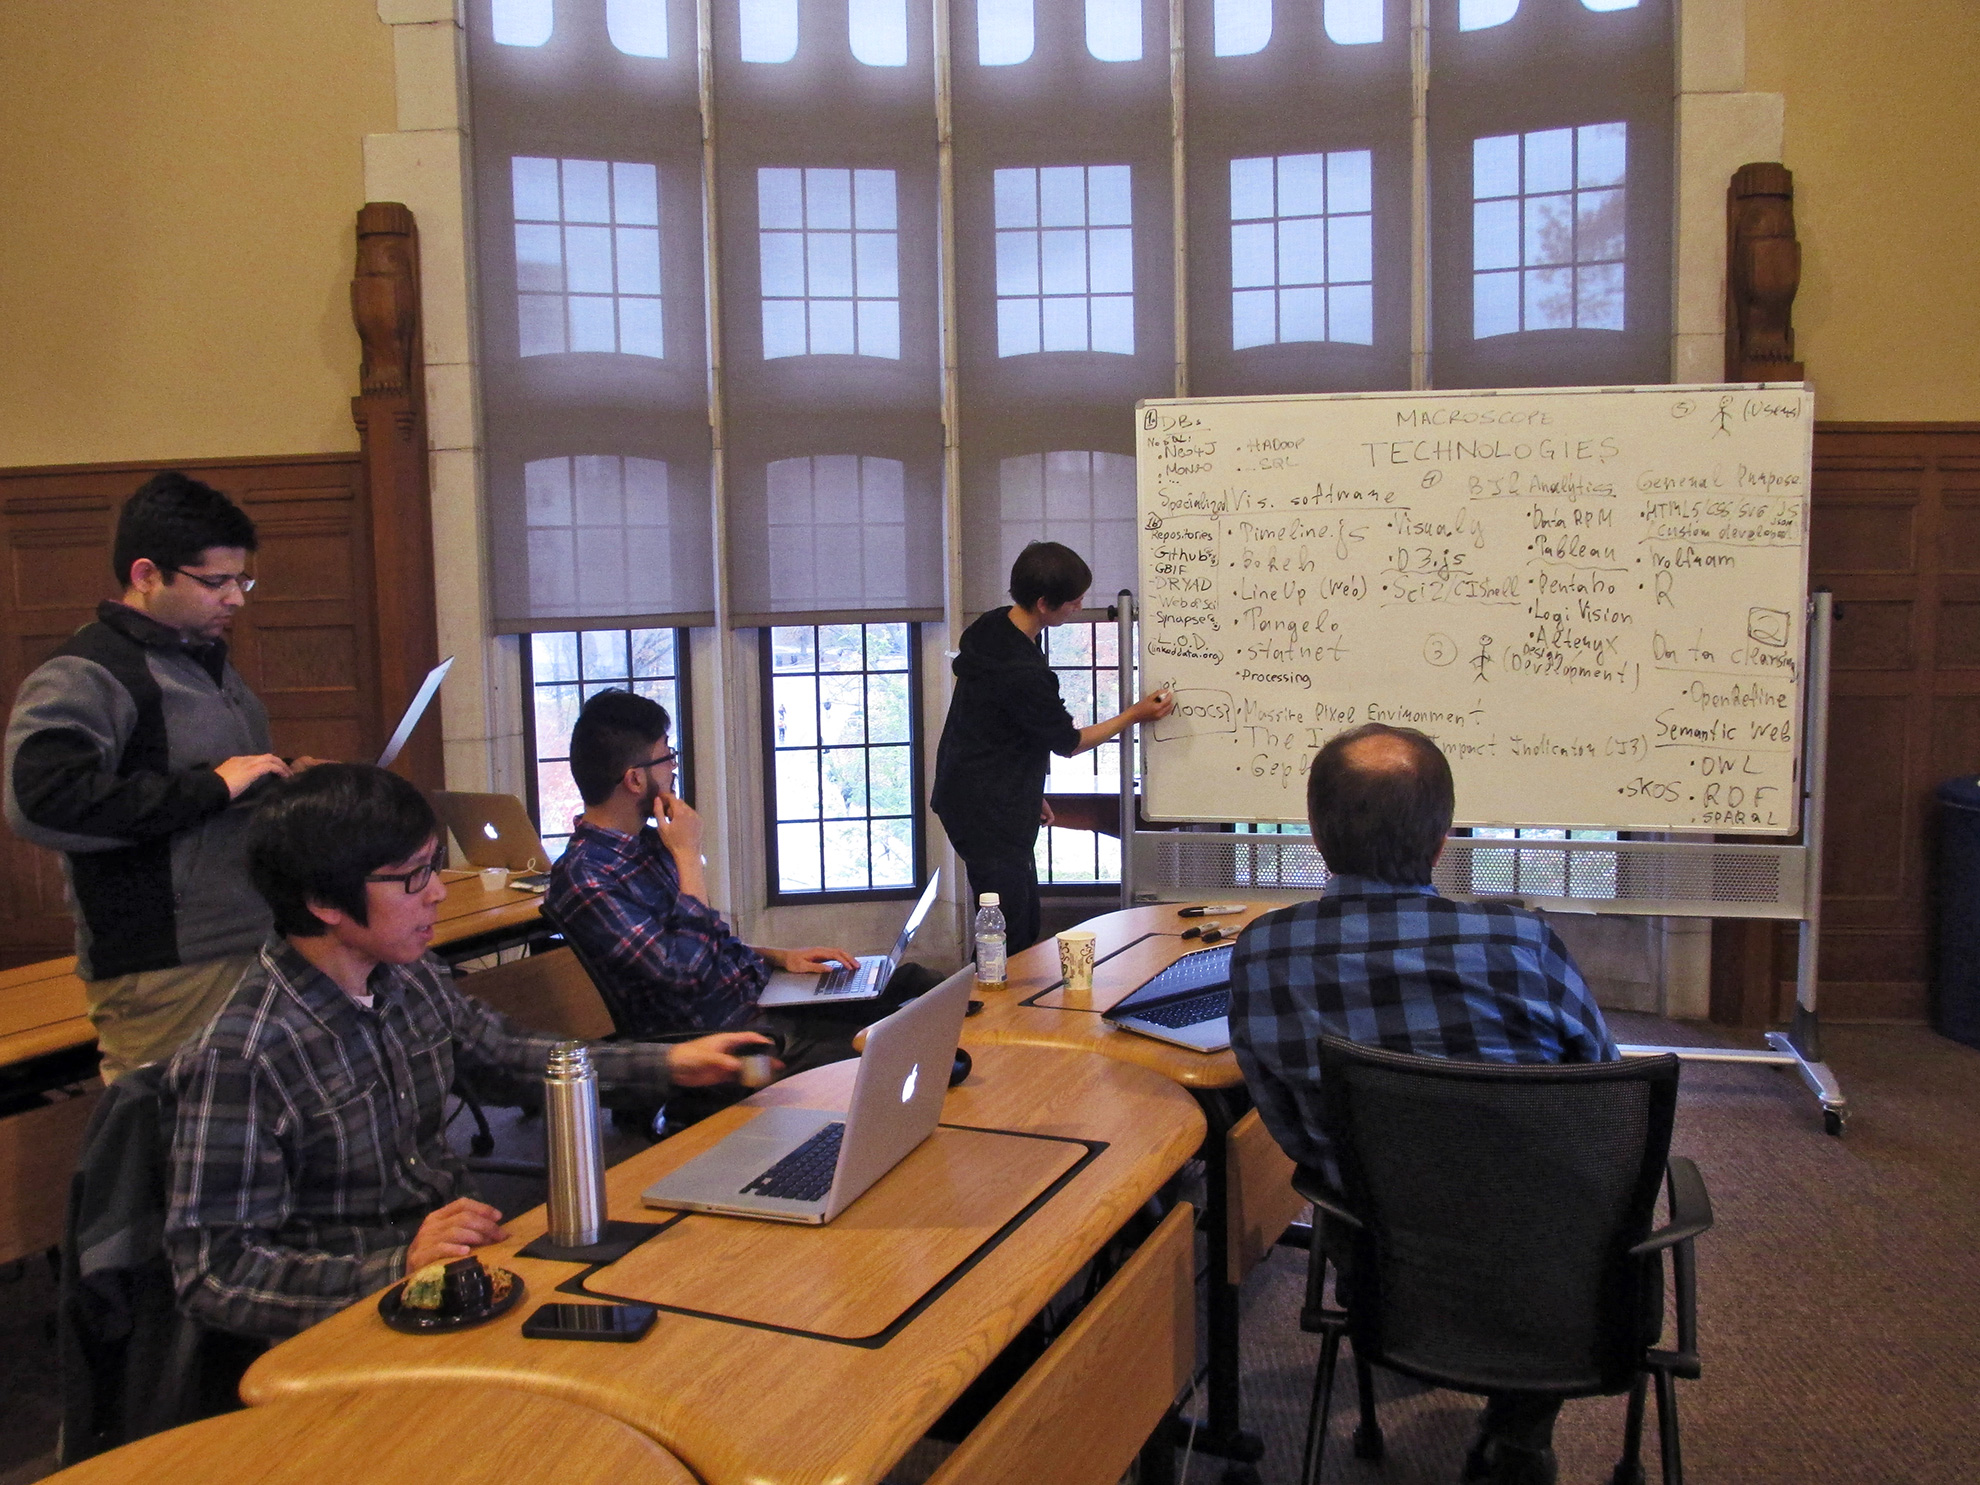
Photos:


Organizers:
Katy Börner
Victor H. Yngve Professor of Information Science, Department of
Information and Library Science, School of Informatics and Computing, Indiana University, Bloomington; Director, Cyberinfrastructure for Network Science
Center & Curator of Mapping Science exhibit, Bloomington, IN
ude.anaidni@ytak
PR^2 | Slides

Daniel Halsey
Senior Software Engineer/Research Analyst, Cyberinfrastructure for Network Science Center, Bloomington, IN
ude.anaidni@yeslahd
PR^2
Workshop Goals & Agenda:
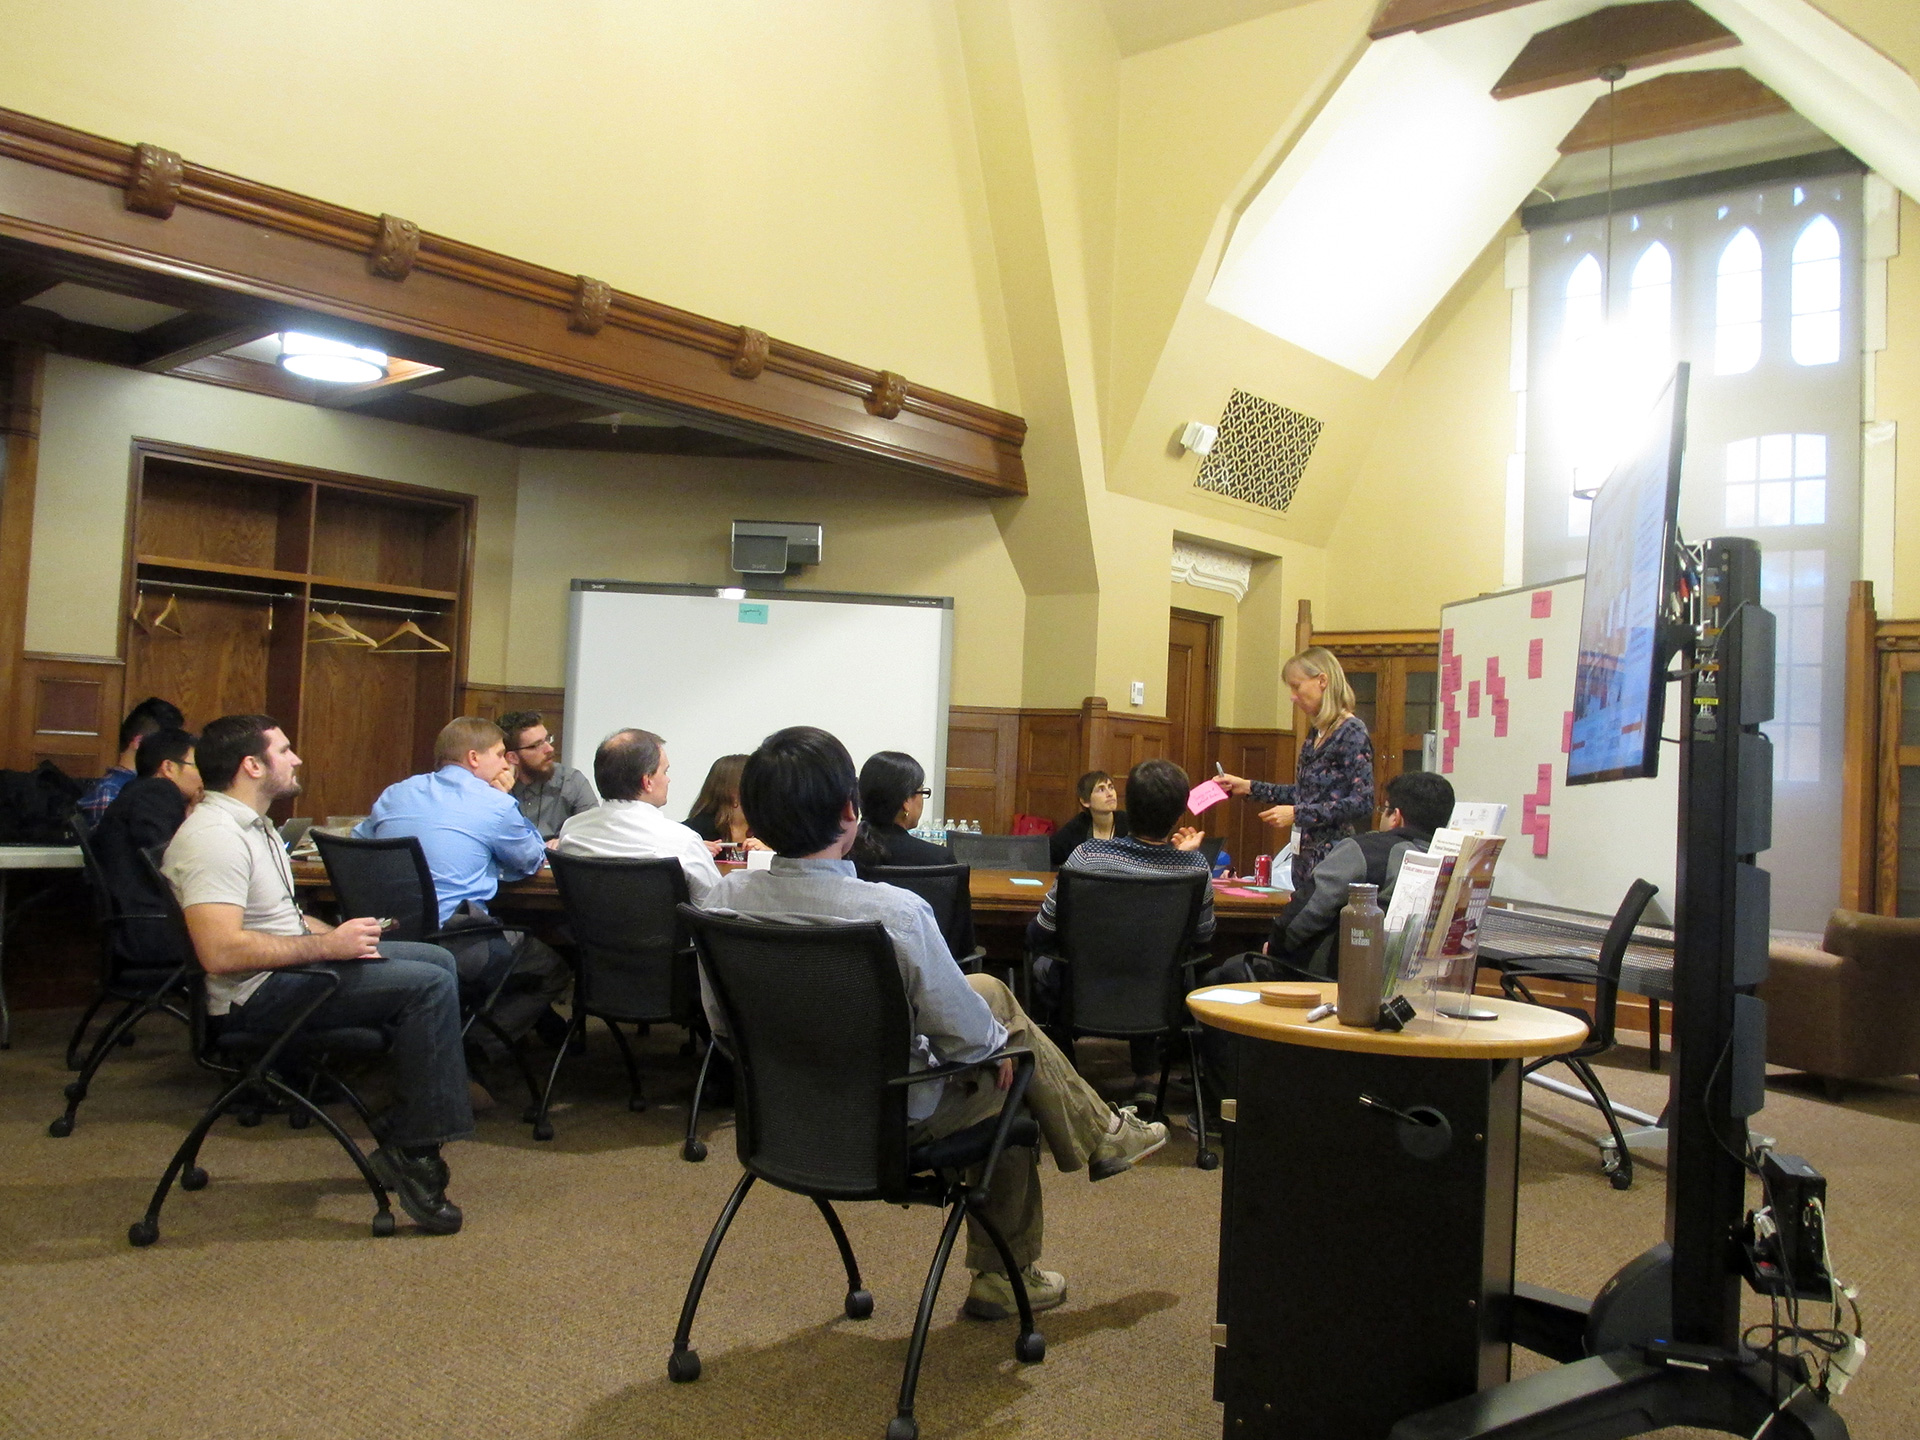
This 1.5 day, invitation-only workshop will bring together programmers and power users of visual analytics desktop tools and online services. Key goals of the workshop are
- improved integration/collaboration between existing tools/developers,
- identification of currently unmet user needs and/or anticipated novel use cases that future tool/service developments should address, and
- discussion of synergies among efforts and possible joint funding applications.
Format is a combination brief presentations, brainstorming sessions, and hands-on sessions--to be finalized when participants are confirmed.
Participants, please fill out this PR^2 and send to Samantha Hale by October 18.Schedule:
Monday, November 3, 2014
| 12:00pm | Collaboration Lunch Welcome by Organizers (Katy Börner and Daniel Halsey) |
| 12:30pm | General Introduction by Participants (5 min per person/organization) |
| 2:00pm | Social Networking Break |
| 2:30pm |
Overview Talks, Woodburn Hall 200 (Open for public) From Table to Graph: Thomson Reuters Visual Analytics – Julia Laurin, Thomson Reuters
NETEAV - Dmitriy Korobskiy, NETE CIShell Tools: The Road Ahead - Daniel Halsey, CNS Center Scaling Up Learning Communities: ecology of open technologies for analytics
and collective intelligence - Tam Kien Duong, CRI Improving Data Visualization Literacy - Katy Börner, CNS Center |
| 4:30pm | Social Networking Break |
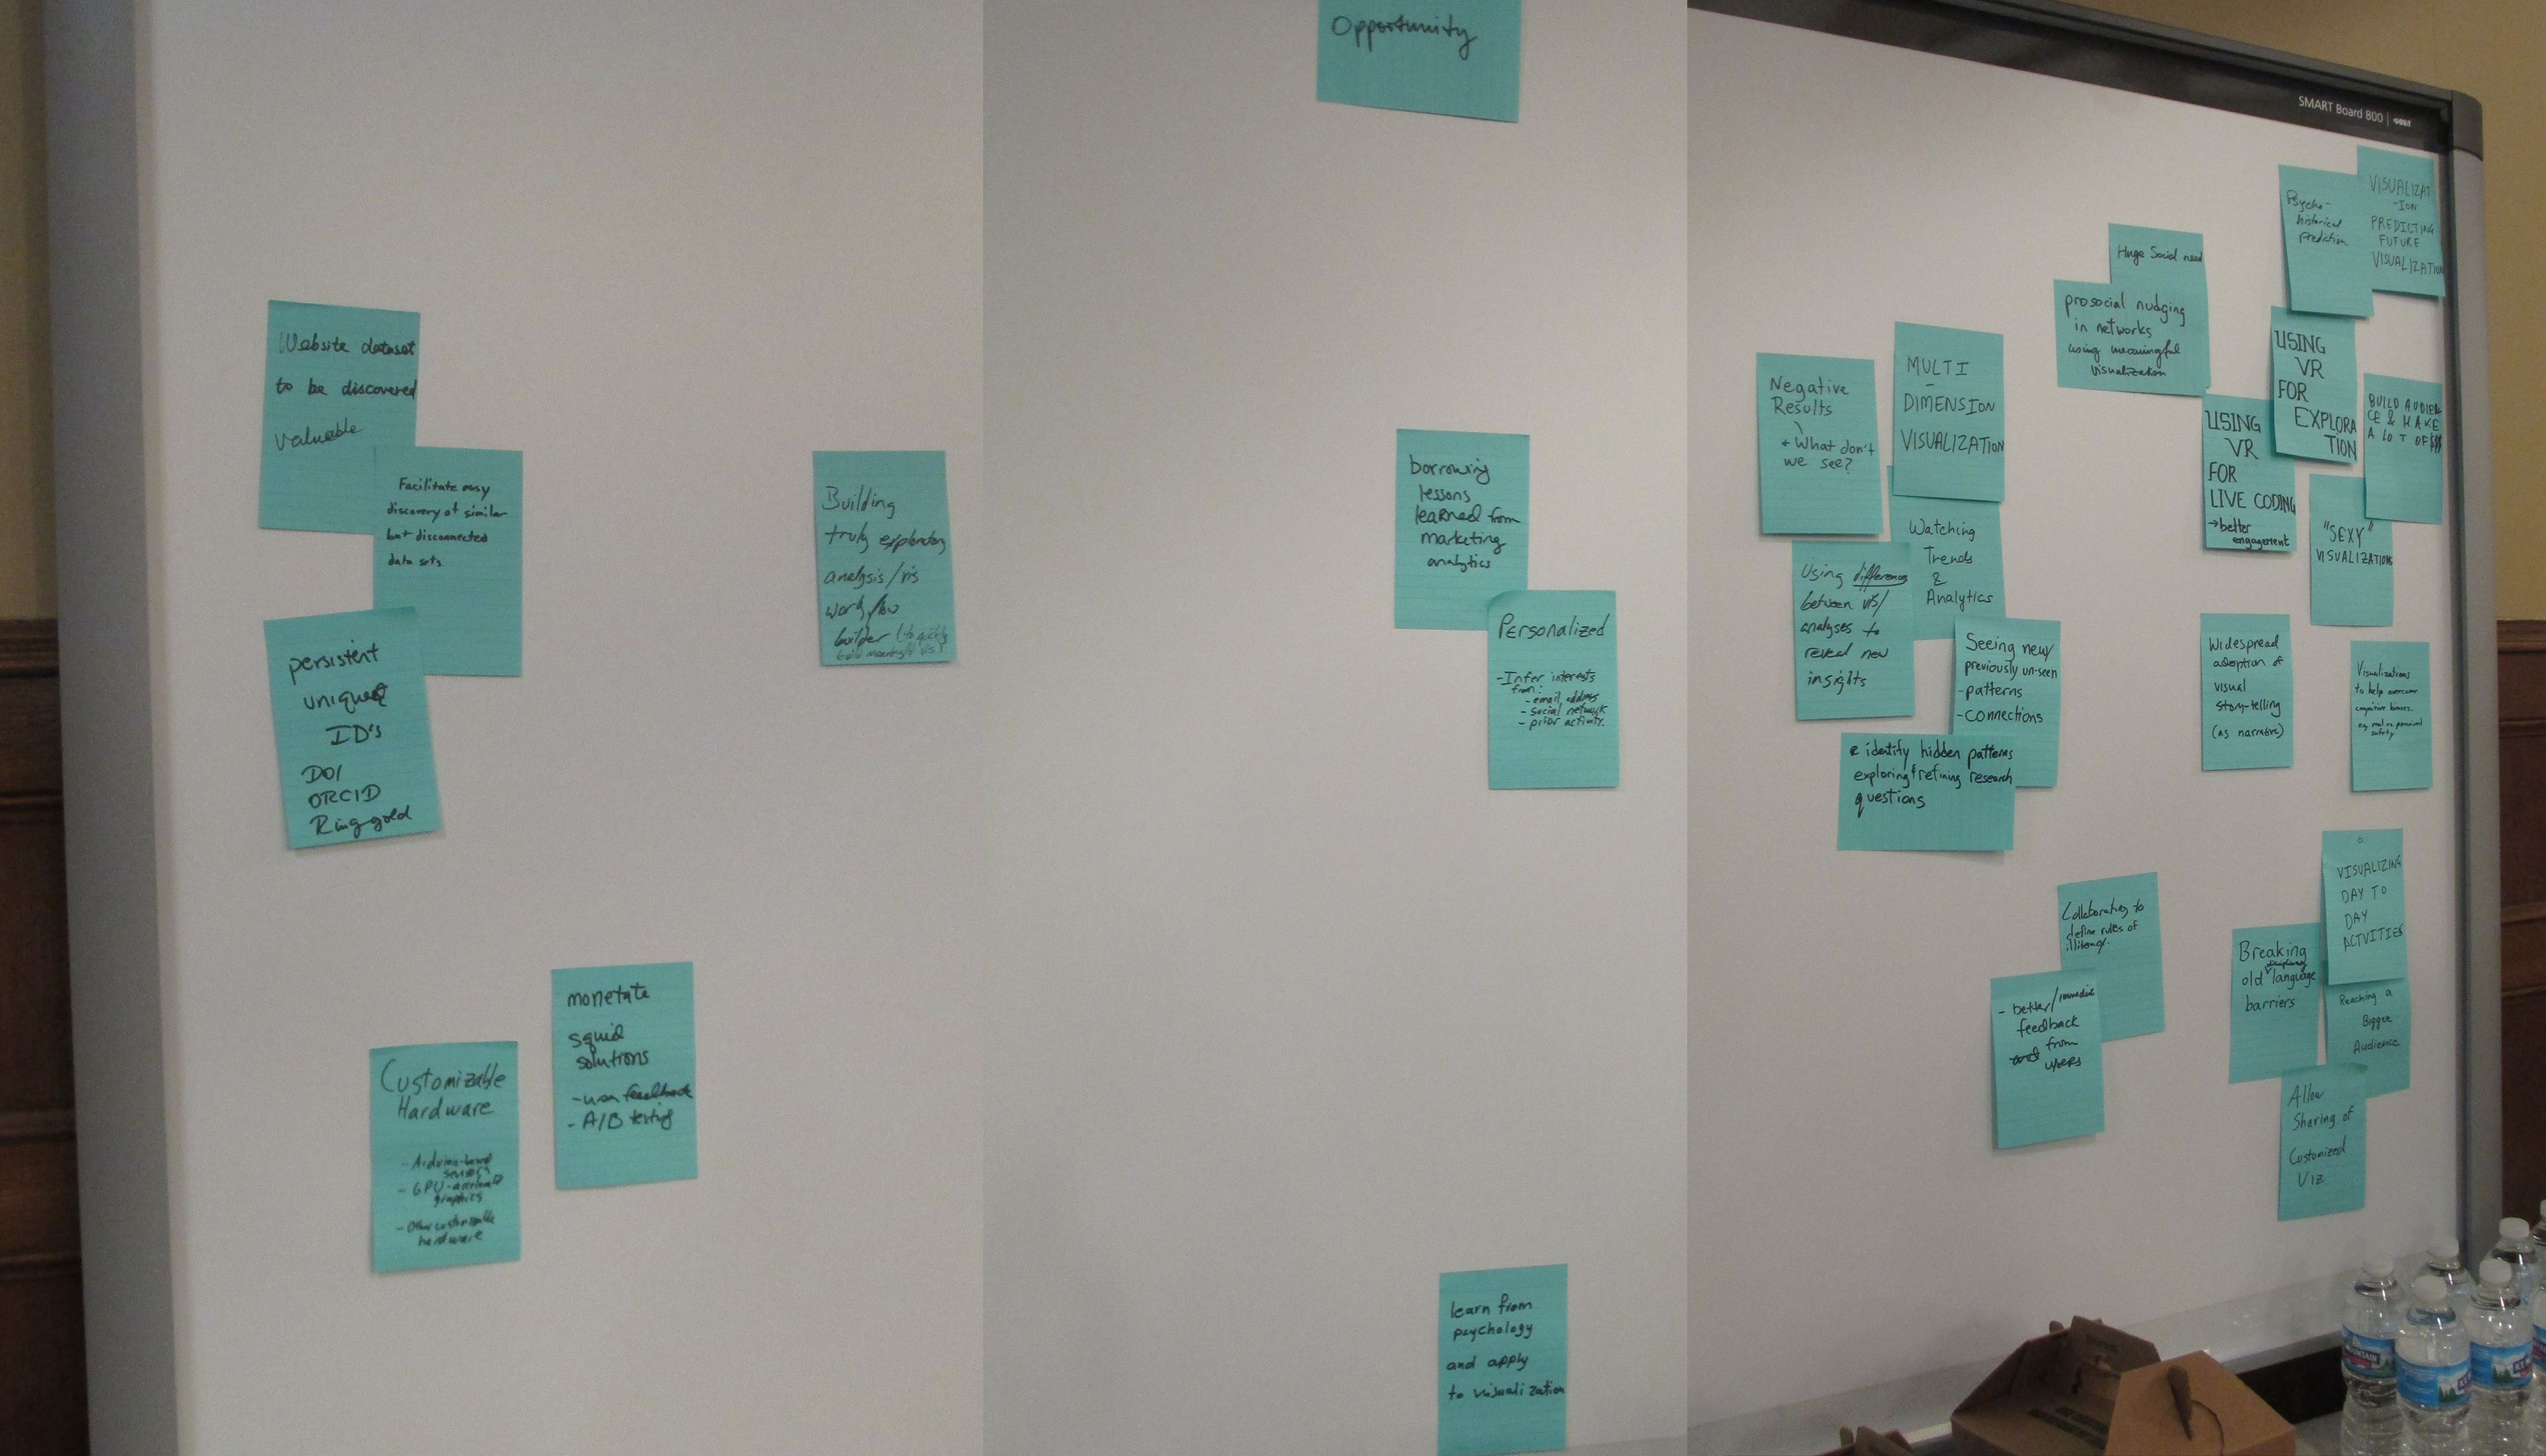
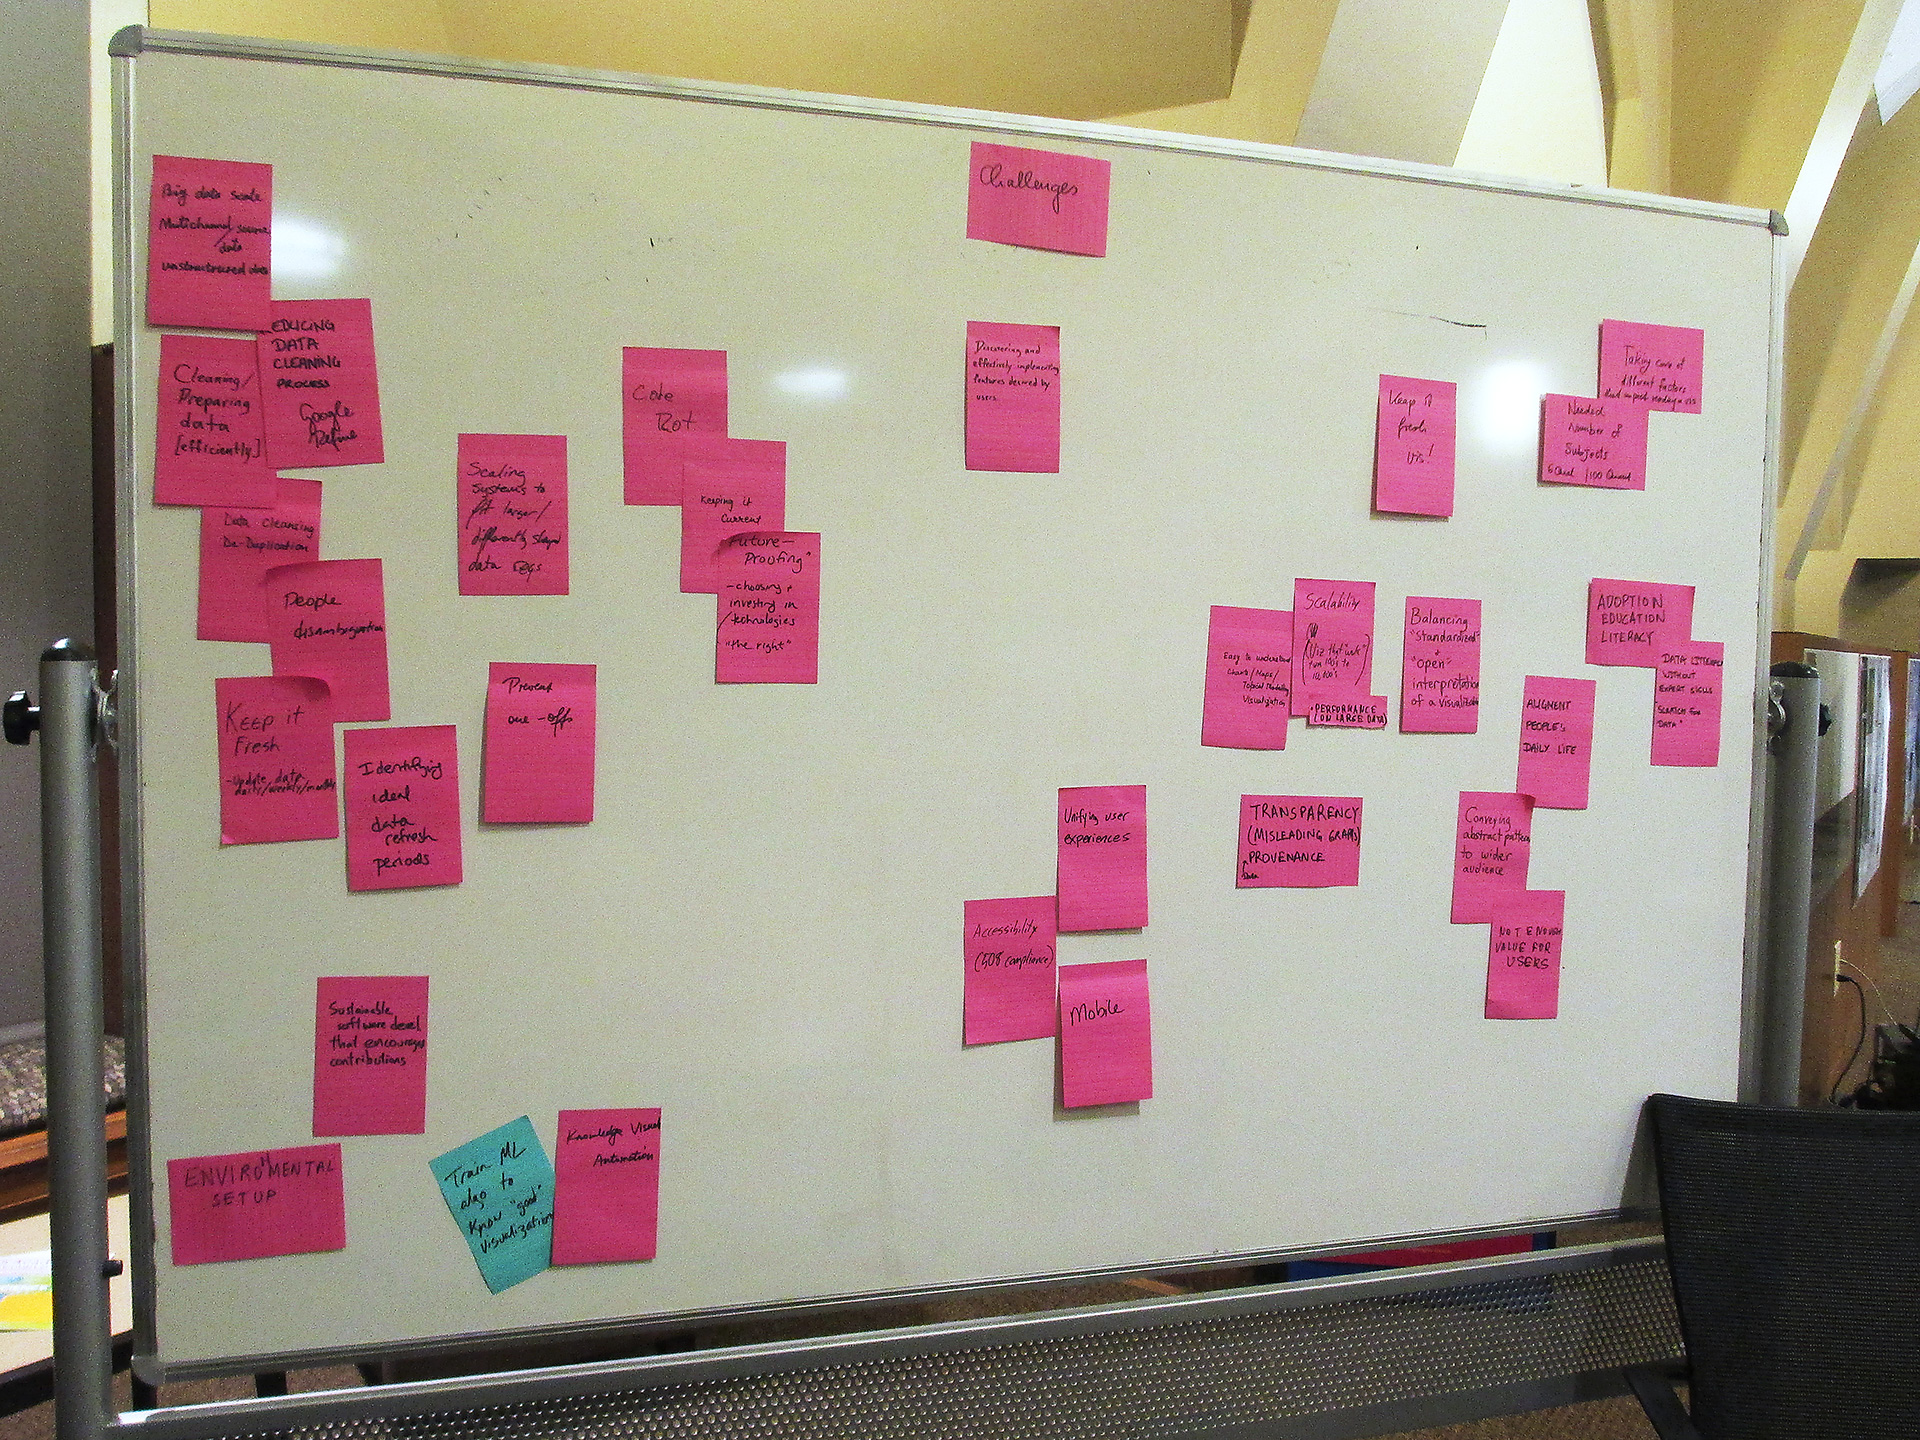
| 5:00pm | Brainstorm of Opportunities and Challenges |
| 6:00 pm | Adjourn |
| 6:30pm |
Joint Dinner Brainstorm |
Tuesday, November 4, 2014
| 8:30am | Breakfast |
| 9:00am | Breakout Sessions: Macroscope Needs and Desires Macroscope Technologies Macroscope Futures |
| 10:00am | Breakout Session Reports |
| 11:00am | Second Best Ideas |
| 12:00pm | Joint Lunch |
| 1:00pm | Breakout Sessions: Macroscope Desktop Tools Macroscope Online Services Macroscope Standards |
| 2:00pm | Breakout Session Reports |
| 3:00pm | Discussion of Collaboration Opportunities |
| 4:00pm | CNS Annual Open House |
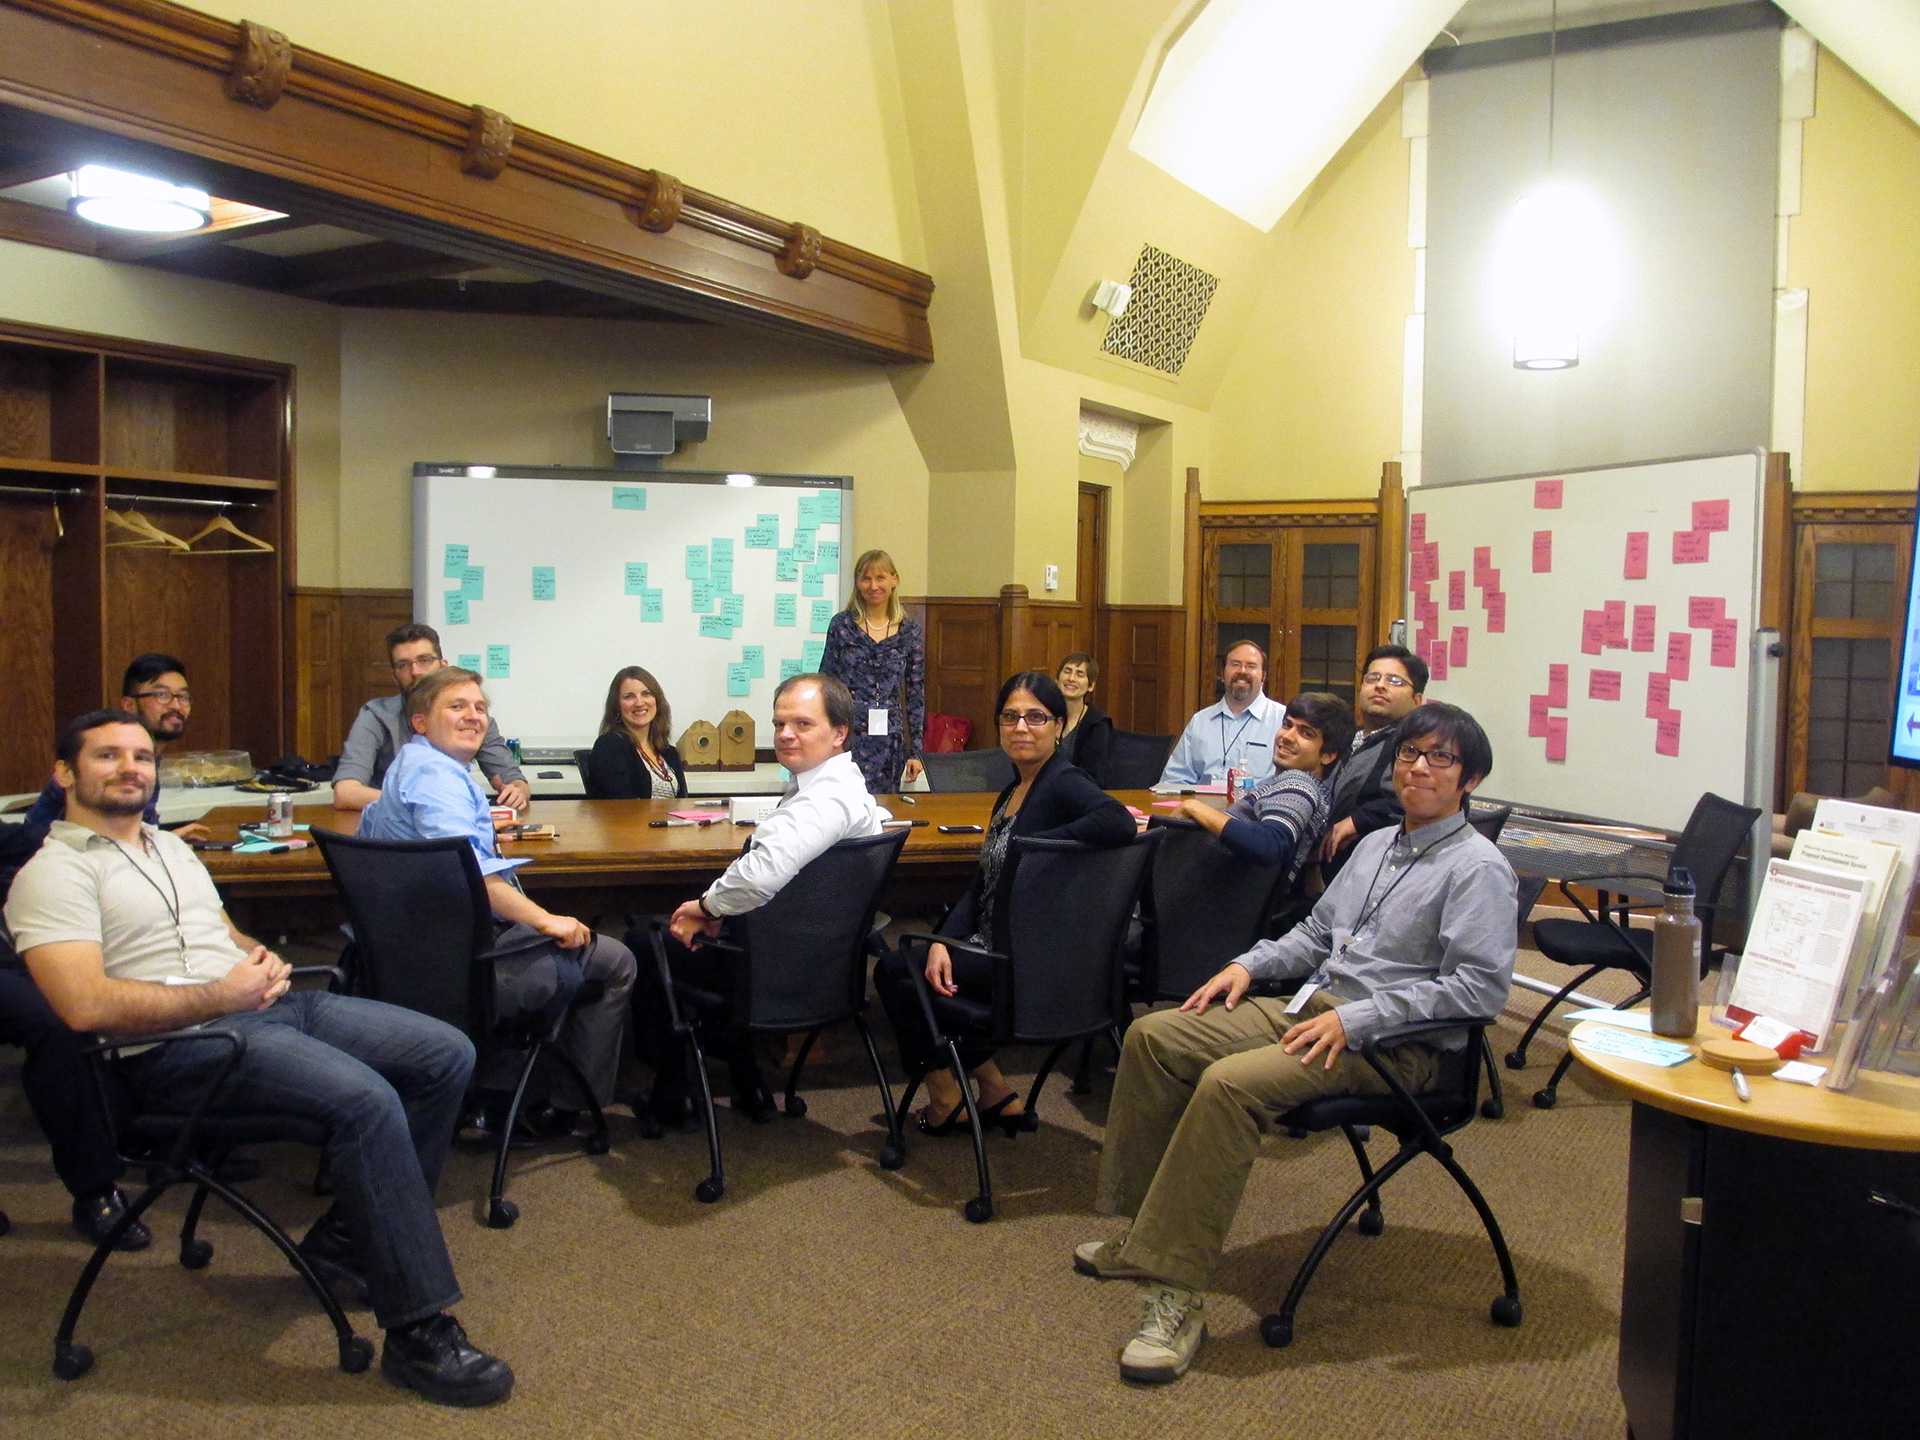
Participants Attending:
Steve Corenflos
Software Developer, CNS Center, IU Bloomington
PR^2
Tam Kien Duong
Research Engineer, CRI
PR^2
Brian Haugen
Health Science Policy Analyst, National Institutes of Health
PR^2
Vivek Karihaloo
Software Engineer, CNS Center, IU Bloomington
PR^2

Dmitriy "DK" Korobskiy
Director, Technology Solutions, NETE
PR^2

Julia Laurin
Director of Product Strategy, Research Management & Analytics, Thomson Reuters
PR^2

Penghui Lyu
School of Information Management, Wuhan University
PR^2 | Slides

Bahador Saket
PhD candidate in Computer Science, University of Arizona
PR^2
Savita Sethi
Director, Technical Solutions, NETE
PR^2
Adam Simpson
Software Developer, CNS Center, IU Bloomington
PR^2
Interested But Cannot Attend:
John Bruer
President, James S. McDonnell Foundation

James Carlson
Executive Director, School Factory, Inc. 501c3; Founder, Bucketworks; Founding Member, Bucket Brigade Inc.

David Chavalarias
CNRS permanent researcher, Centre d'Analyses de de Mathématiques Sociales (CAMS), Ecole des Hautes Etudes en Sciences Sociales (EHESS)

Chaomei Chen
Professor, College of Information Science and Technology, Drexel University
Fernando Galindo-Rueda
Senior Economist, OECD
Marco A. Janssen
Associate Professor, School of Human Evolution and Social Change; Director of the Center for the Study of Institutional Diversity, Arizona State University
Stephen Kobourov
Professor, Department of Computer Science, University of Arizona

Diana Lucio
Observatorio Colombiano de Ciencia y Tecnología

Paul Martin
Senior Vice President, Science Learning, Science Museum of Minnesota

Michael McLennan
Senior Research Scientist, Purdue University
PR^2

Anders Munk
Visiting Research Fellow, médialab; Associate Professor, University of Aalborg
James Onken
Senior Advisor to the Deputy Director for Extramural Research, NIH Director, Office of Data Analysis Tools and Systems

Abel Packer
Director of SciELO / FAPESP Program
Monica Salazar
Observatorio Colombiano de Ciencia y Tecnología

Martin Schaaper
Programme specialist STI statistics and Communication and Information statistics
Sandeep Somaiya
Managing Director, NETE
Mike Thelwall
Professor of Information Science, University of Wolverhampton
Beverley Thomas
Biotechnology and Biological Sciences Research Council (BBSRC)
Jinneth Tique
Information Scientist Specialist, Observatorio Colombiano de Ciencia y Tecnología
PR^2
Background Information:
This is the fifth workshop of its kind, see:
- Workshop on Information Visualization Software Infrastructures
- Towards an All-in-One Tool for Network Scientists Interested in Large Scale Network Analysis, Modeling, and Visualization
- JSMF Workshop on Plug-and-Play Macroscopes
- Plug-and-Play Macroscopes
The "Plug-and-Play Macroscopes" paper.
Information Visualization MOOC that teaches how to use the tools.
Travel/Housing:
Please contact Samantha Hale (ude.anaidni@elahjs) for travel arrangement.
Directions:
See the contact page for the Cyberinfrastructure for Network Science Center, http://cns.iu.edu/contact.html or contact Samantha Hale (ude.anaidni@elahjs).
Acknowledgments:
This effort is supported by the Cyberinfrastructure for Network Science Center at Indiana University. A special thanks to the Social Science Research Commons (SSRC) for providing a location for the workshop.