Visual Insights: A Practical Guide to Making Sense of Data
Click on the cover to preview the book
Katy Börner & David E. Polley
Published by MIT Press
Order via Amazon, Barnes & Noble, or MIT Press (enter coupon code "BVI20" on MIT web site for 20% discount).
$25.00
7.5 x 9, 292 pp.
978-0-262-52619-7
High-Resolution Figures
Introduction
This textbook offers a gentle introduction to the design of insightful visualizations. It seamlessly blends theory and practice, giving readers both the theoretical foundation and the practical skills necessary to render data into insights.
The first chapter introduces a theoretical framework that covers temporal, geospatial, topical, and network data analyses and visualizations. It is followed by chapters that detail visualizations and workflows that aim to answer “when” (temporal data), “where” (geospatial data), “what” (topical data), and “with whom” (trees and networks) questions. The design and deployment of interactive online visualizations is discussed. Each chapter has a hands-on part that demonstrates how plug-and-play macroscope tools can be used to run advanced data mining and visualization algorithms. The final two chapters present exemplary case studies and discuss future developments.
The book accompanies the Information Visualization MOOC that attracted students, scholars, and practitioners from many fields of science and more than 100 different countries.
Quotes by Experts
“In the world of visualization and information graphics, the bibliography about thematic maps and statistical graphs is becoming abundant, little by little. However, studies of how to design network diagrams and conceptual maps are rare, and usually available only through scientific publications. Katy Börner’s and David Polley’s book is the first serious attempt at offering a theoretical and practical introduction to this discipline, aimed not just at specialists but at any reader, regardless of her or his background. I foresee that it’ll become the textbook of choice for many instructors.”
—Alberto Cairo, Professor of the Professional Practice at the School of Communication of the University of Miami and author of The Functional Art: an Introduction to Information Graphics and Visualization
“A good visualization is never easy-beesy done; good visualization is a science, a craft, and an art at once. If you want to become a visual data explorer and learn to produce meaningful visualizations, this book is a good guide for such a journey. It is a must-read for students at iSchools and those in the Digital Humanities, and a recommendation for inhabitants of the various interdisciplinary valleys in the science landscape.”
—Andrea Scharnhorst, Head of Research at Data Archiving and Networked Services and member of the e-humanities group at the Royal Netherlands Academy of Arts and Sciences in Amsterdam, Netherlands.
“In this age of knowledge abundance, policymakers and the public need to quickly understand complex information, and this book takes a giant leap forward in this arena. The knowledge system has become a global enterprise, and it is one that involves collaboration and interdisciplinary linkages. These trans-boundary links require new metrics and the use of new methods of examination and explanation. Katy Börner’s and David Polley’s book creates a map into the new knowledge terrain that we will all be transiting soon.”
—Caroline S. Wagner, Milton and Roslyn Wolf Chair in International Affairs; Director, Battelle Center for Science & Technology Policy, John Glenn School of Public Affairs, Ohio State University
“Following in the footsteps of the richly illustrated and highly informative book “The Atlas of Science: Visualizing What We Know”, Professor Katy Borner’s new book Visual Insights: A practical Guide to Making Sense of Data brings theory and practice in seven manageable chapters to both new initiate and engaged user, giving an insightful overview of the field, and making accessible the methods and techniques to empower the reader to become a visualization practitioner.”
—George Legrady, Director of the Experimental Visualization Lab and Chair of the Media Arts & Technology doctoral program at the University of California, Santa Barbara
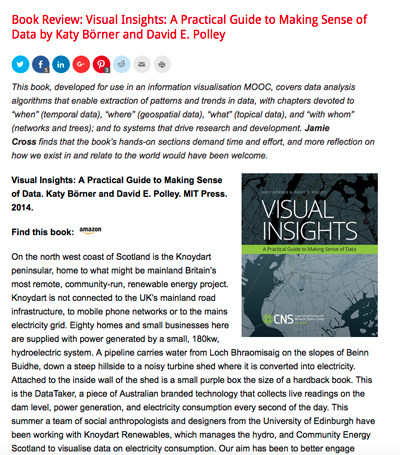
Press
September 2014
London School of Economics and Political Science
[PDF]
High-Resolution Figures
Chapter 1
Figure 1.7
Figure 1.9

Figure 1.11
Figure 1.14
Figure 1.15
Figure 1.16
Figure 1.17
Chapter 2
Figure 2.1
Figure 2.2
Figure 2.3
Figure 2.4
Figure 2.5
Figure 2.26
Figure 2.32
Figure 2.36
Chapter 3
Figure 3.1
Figure 3.2
Figure 3.3
Figure 3.4
Figure 3.5
Figure 3.10
Figure 3.17
Figure 3.20
Figure 3.22
Figure 3.28
Figure 3.37
Chapter 4
Figure 4.1
Figure 4.2
Figure 4.3
Figure 4.4
Figure 4.5
Figure 4.12

Figure 4.15
Figure 4.17
Chapter 5
Figure 5.1
Figure 5.2
Figure 5.3
Figure 5.4
Chapter 6
Figure 6.1
Figure 6.2
Figure 6.3
Figure 6.4
Figure 6.5
Figure 6.36
Figure 6.38
Figure 6.41

Figure 6.43
Figure 6.46
Chapter 7
Figure 7.20
Chapter 8

Figure 8.1
Figure 8.2
Figure 8.3
Figure 8.4
Figure 8.5

Figure 8.6