Workshops
SCWS Session: Visualizing STEAM Data in Support of Smart Decision Making
Date
November 15-17, 2017 (Exact Date TBD)
Meeting Place
Science Centre World Summit 2017,
National Museum of Emerging Science and Innovation (Miraikan)
Tokyo, Japan
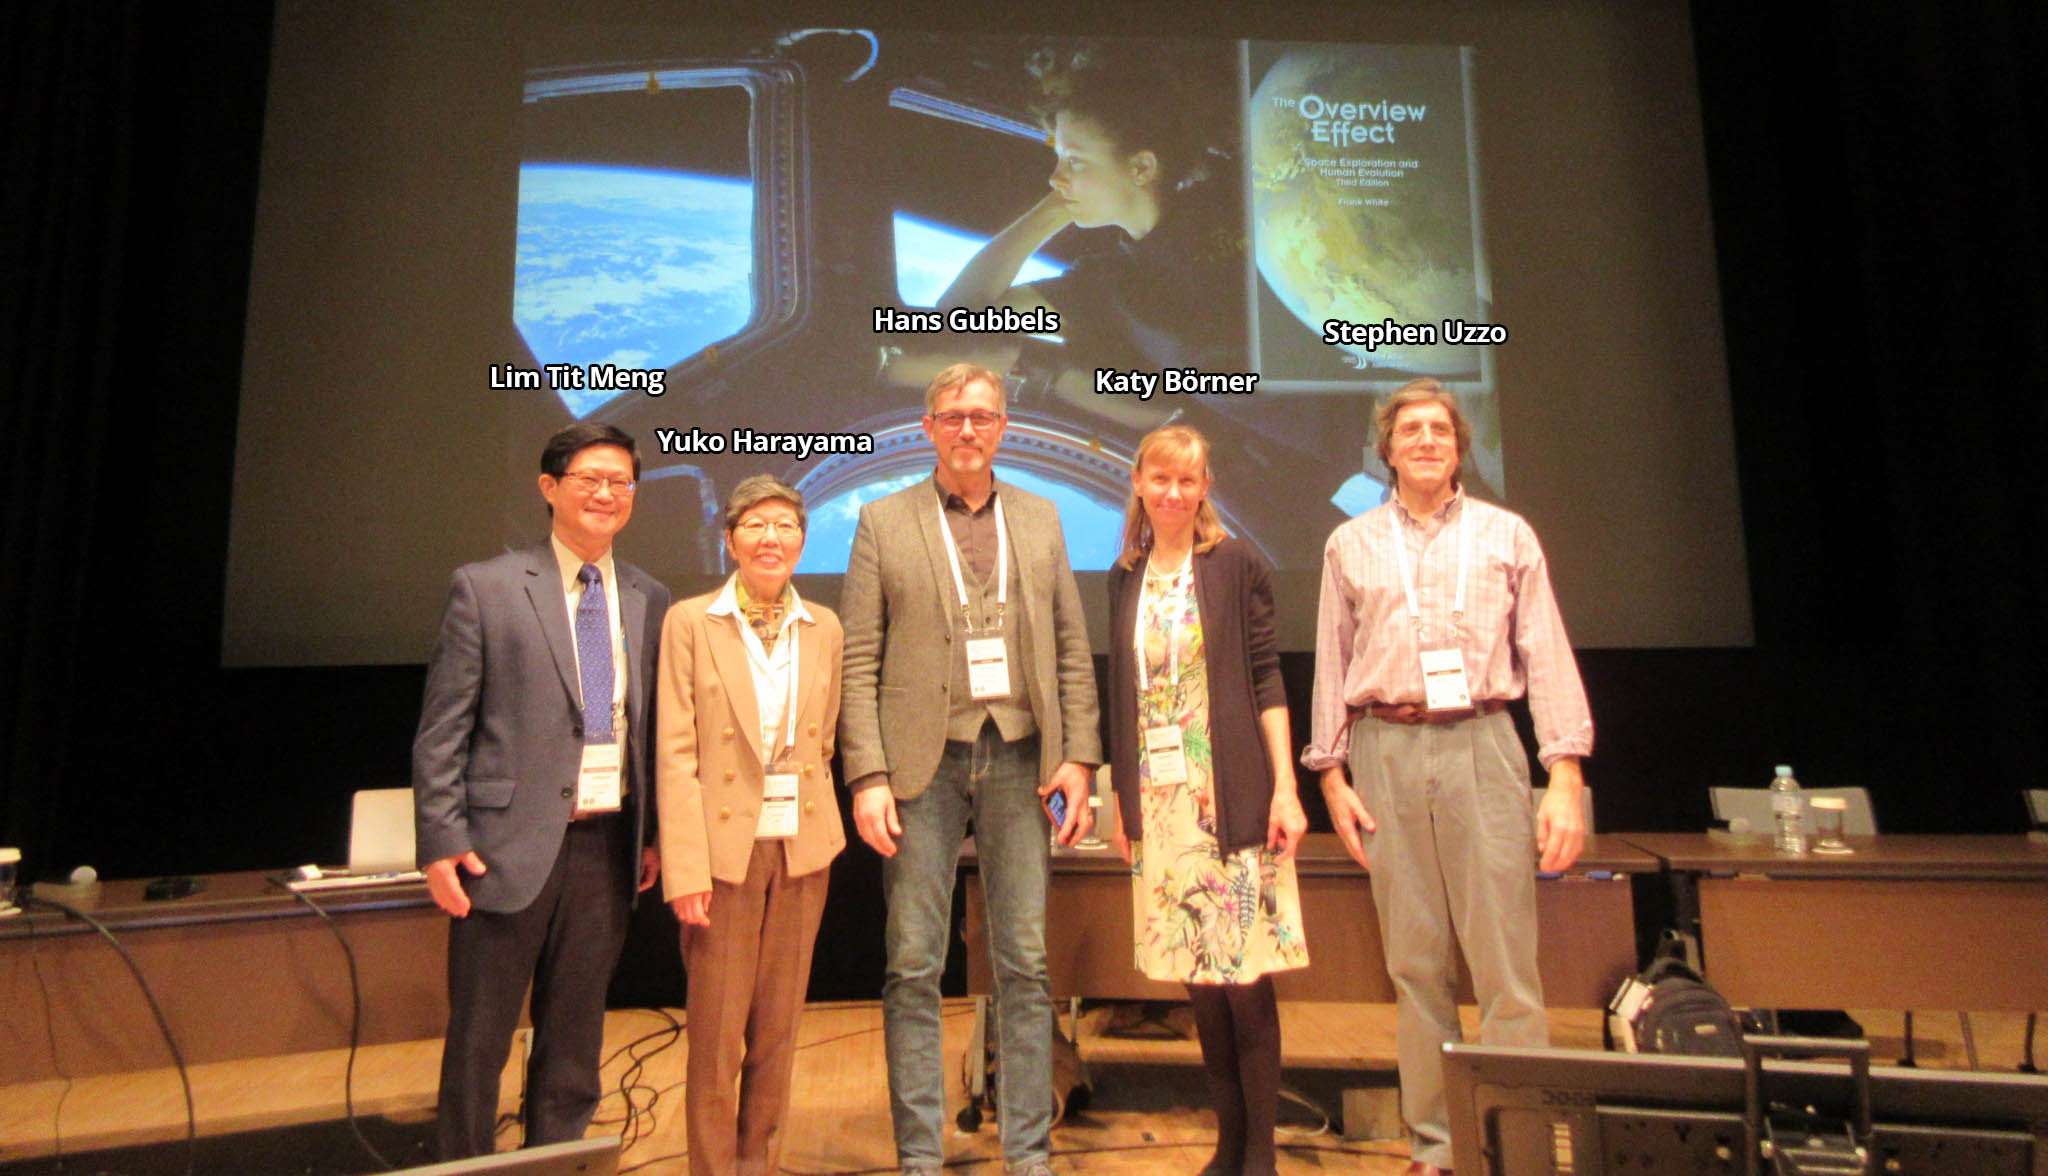
Session Moderator
Katy Börner (Indiana University, USA)
Summary
Visualizations are a powerful means for bridging cultural, language, or expertise gaps. They help engage a wide range of stakeholders in the discussion of diverse ideas and perspectives to arrive at smart solutions to global challenges.
Session Presenters
Katy Börner, Victor H. Yngve Distinguished Professor of Information
Science
Indiana University
USA
SlidesStephen Uzzo, Chief Scientist
New York Hall of Science
USA
SlidesYuko Harayama, Executive Member
Council for Science, Technology and Innovation
Japan
SlidesLim Tit Meng, CEO
Science Centre Singapore
Singapore
SlidesHans Gubbels, Founder/CEO
Columbus Earth Center, Cube Design Museum, Continium Discovery Center
The Netherlands
SlidesDescription
In the information age, being able to “read and write” data visualizations is becoming as important as being able to read and write text. Data and visualization literacy is important for understanding STEAM developments and to strategically approach global issues.
This session features presentations by researchers and practitioners that develop approaches, tools, and experiences which aim to improve the data visualization literacy of their users. Visualizations of water, global warming, biodiversity, energy, and infectious diseases, health, and urban growth data will be featured as well as visualizations of STEAM data that open people’s minds and hearts to the complexity, beauty, and value of scholarly activity, innovation, and art. We will demonstrate how data visualization and related physical and electronic gaming approaches can be used to open rich dialogues around crucial issues and serve as a powerful means of making information accessible, salient, and memorable.
Discussions will focus on how to best use the power of big data and the continuously evolving set of data mining and visualization tools to collaboratively map the state of our world and to empower the personal and professional decision making by diverse stakeholders, including the public, to achieve sustainability.